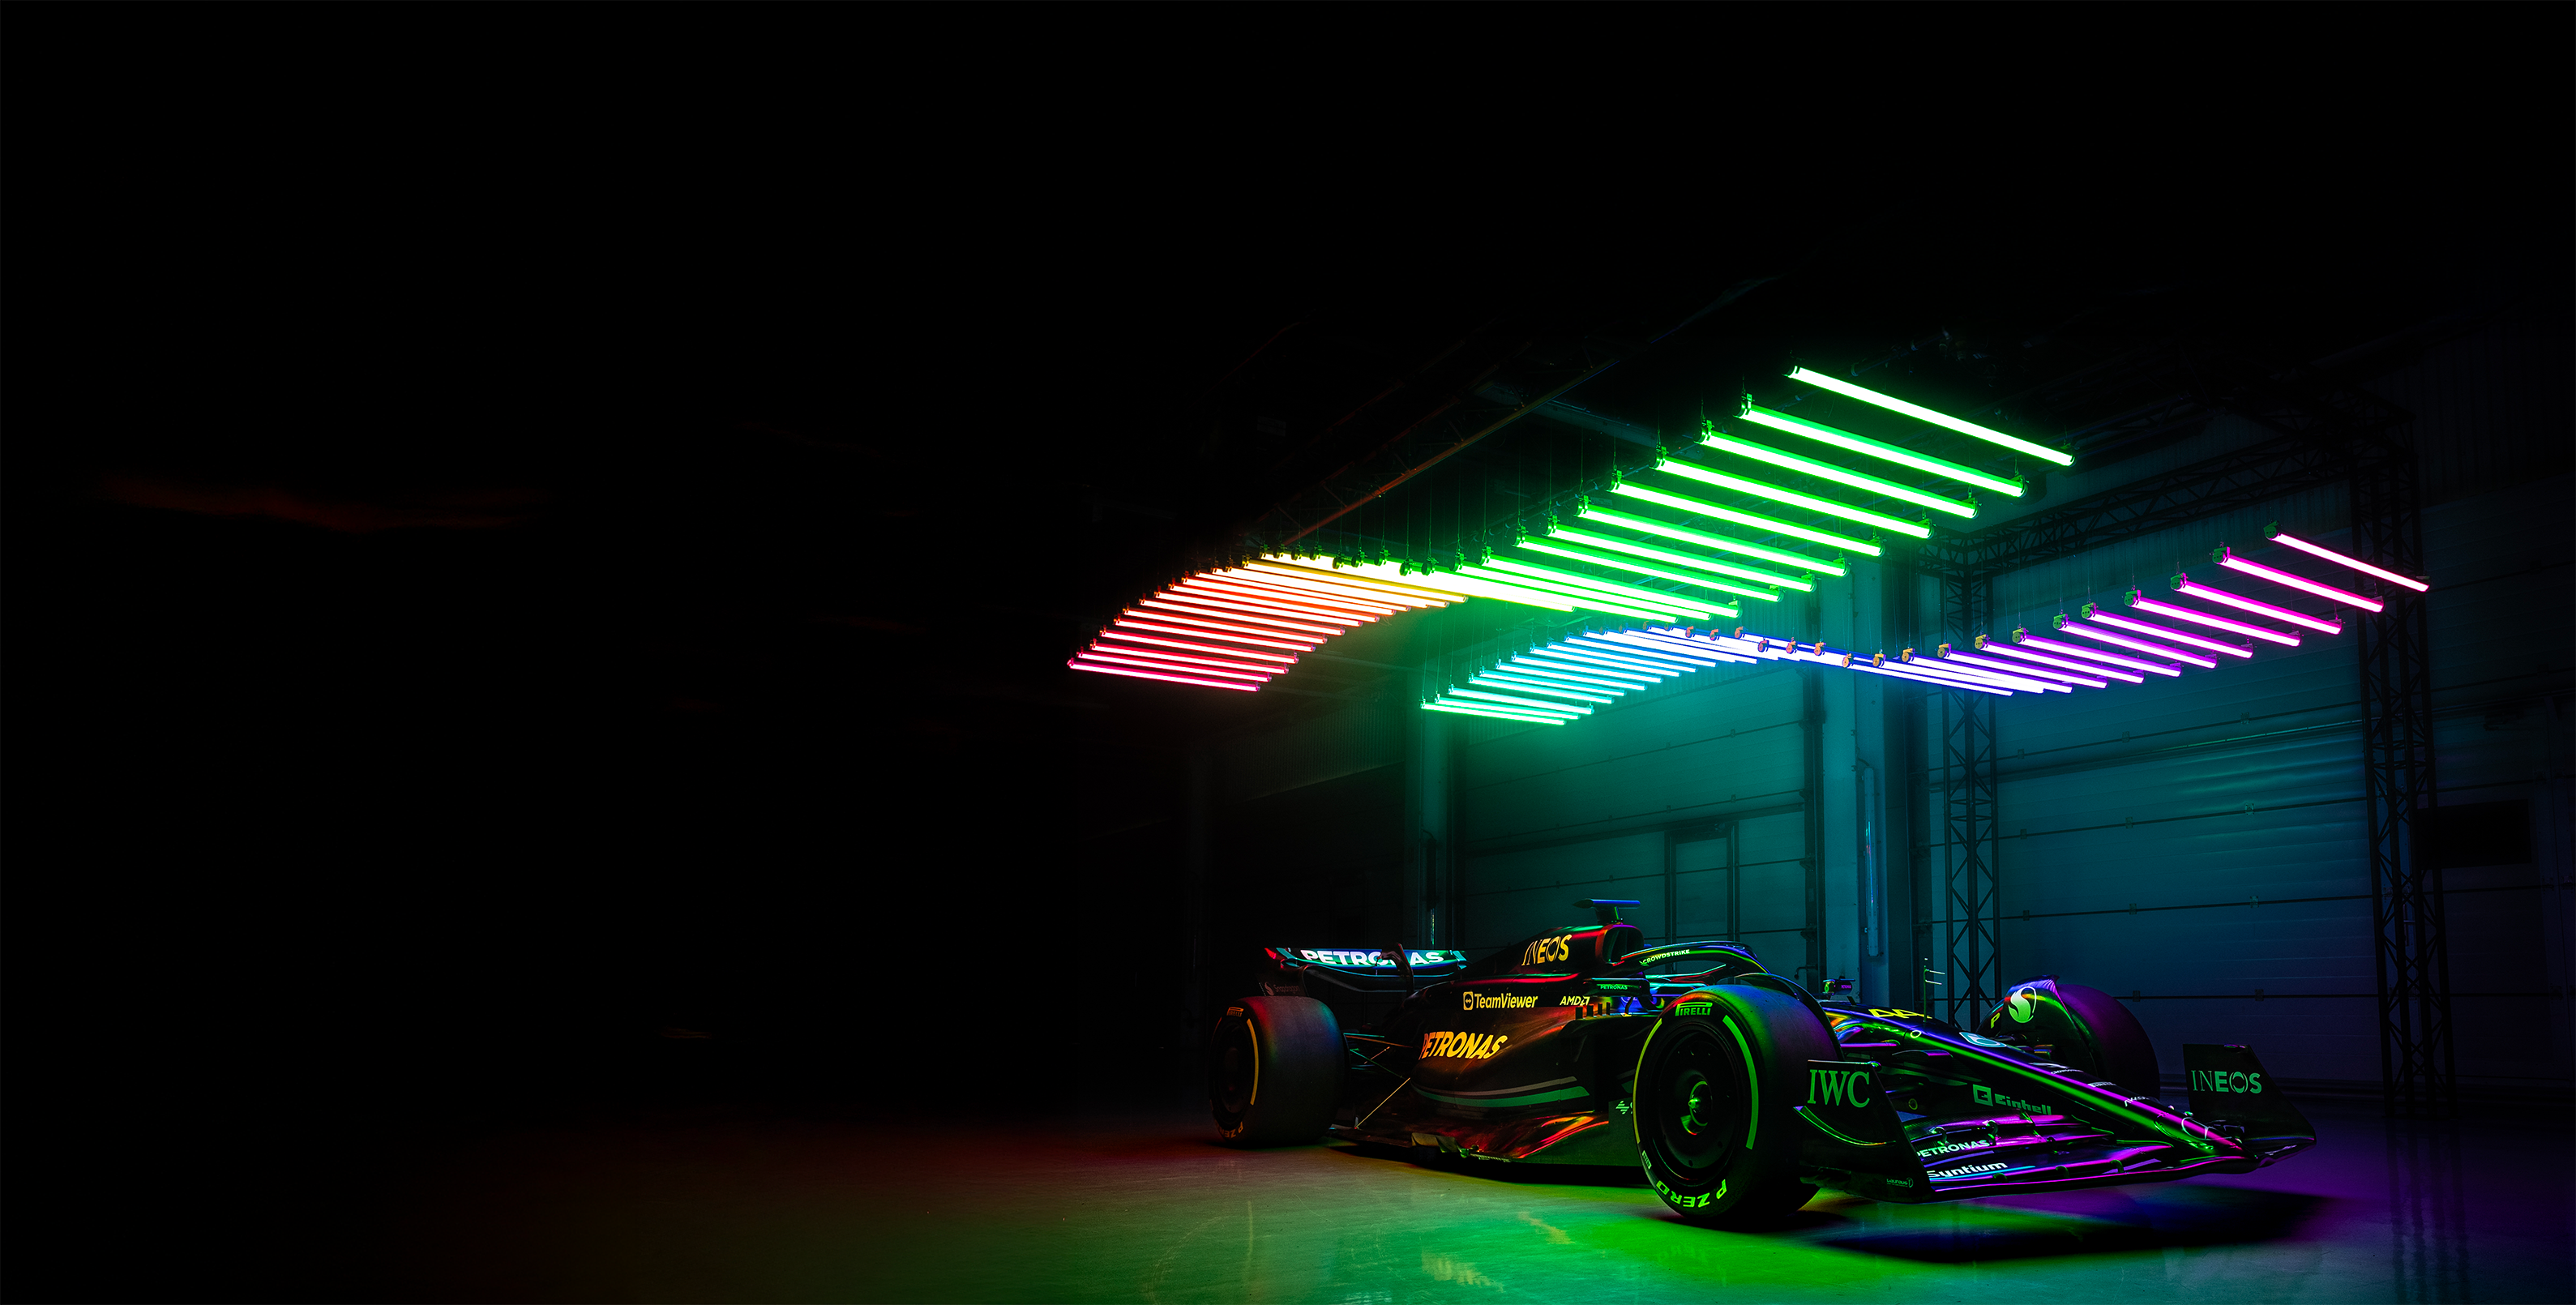
Formula 1 accidents
Role
UI Designer & Font-end dev
Duration
A few weeks
Tools
Figma, Visual studio code

2022 | Second year of Bachelor's degree.
Data Visualization course.
I developed this project in 2022 during the Data Visualization course in my second year of Bachelor's degree. The main goal was to explore D3, Leaflet, and use JavaScript to display dynamic visualizations on a web page. When given the choice to work solo or in a team on a project that truly resonated with us, the answer was obvious to me: Formula 1. A sport where data is everything - lap times, telemetry, crashes - each number tells a story. This project was my way of merging my passion for racing with my love for visual storytelling.
Data-driven exploration: uncovering insights from F1 data
While the Ergast API provides extensive Formula 1 data, it is not sufficient on its own for users to establish correlations between different variables that could explain accidents. To address this, additional data was sourced from Wikipedia’s API for circuit descriptions and from a GitHub repository containing track layouts. Integrating these different datasets was challenging due to variations in data structure and completeness, but it was necessary to provide users with a broader context to explore potential accident causes.
By enriching the dataset with circuit layouts and descriptions, this project allows users to analyze accident trends in Formula 1 more effectively. This expanded dataset makes it possible to explore potential correlations between factors such as track characteristics, maximum speeds, and accident frequency, offering deeper insights into what might contribute to crashes. Moreover, this project served as a valuable opportunity to practice data visualization techniques, which would later be essential for my Bachelor’s project, allowing me to refine my skills in presenting complex data effectively.
For the 15-day UI challenge, the goal was to design 15 different interfaces, each based on a specific page, theme, and constraint chosen randomly. These designs were created under tight time constraints and specific design challenges to foster creativity and improve UI skills.
The pages included in the challenge were:
Each page was designed using one of the following themes:
The constraints for each challenge included:
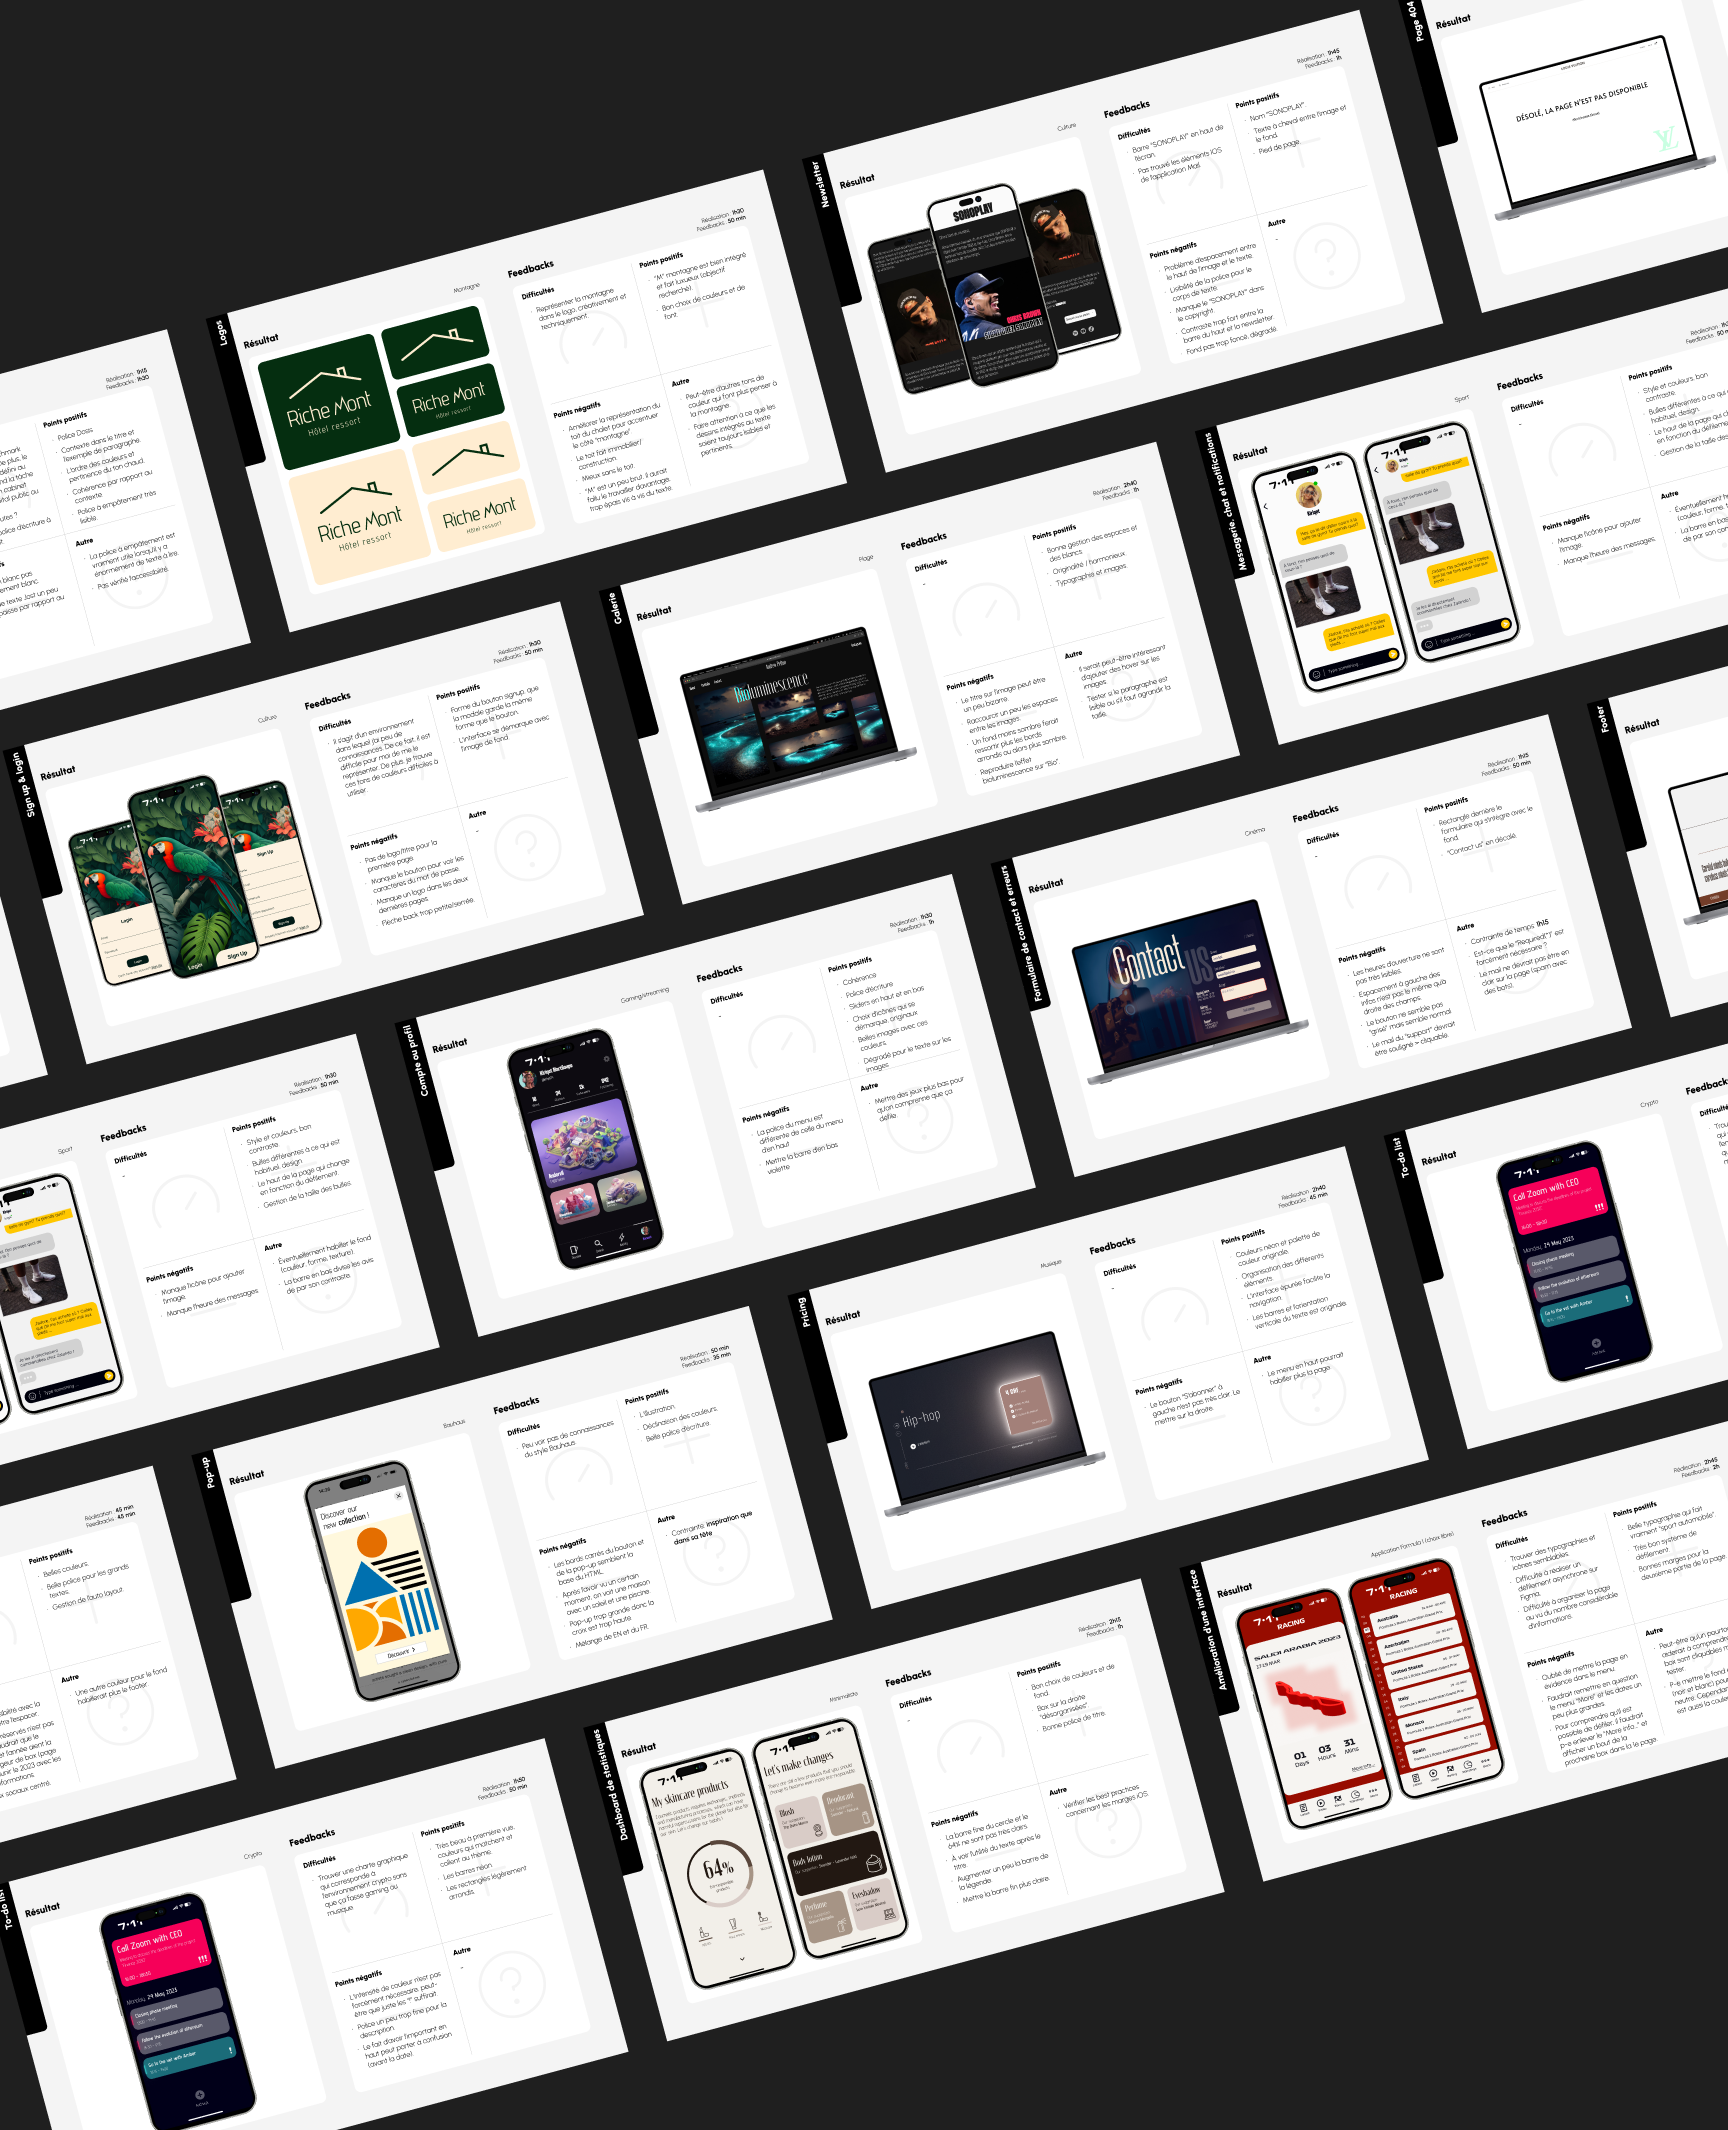
At the end of this self-directed learning experience, I reflected on the progress made and the goals I had set for myself at the beginning of the challenge.
Mastering auto-layouts and explaining them easily was successfully achieved. I used auto-layouts multiple times and practiced explaining them to my classmates. Testing new Figma extensions and identifying three useful ones for my Bachelor’s project was also met. The three most useful Figma extensions I discovered were Glow, Iconify, and Font Preview. Designing UI elements with colors and typography I had never used before was successfully completed. I explored new typography and ensured that each design had a distinct color palette.
Designing different types of statistics in Figma was only partially achieved. Figma is not the most optimal tool for creating complex statistical visualizations. However, I managed to implement minimalist statistics in one of the UI design challenges. Improving my critical thinking and creativity was met. Since each UI challenge had a unique theme, I had to research a wide range of graphic styles. The peer feedback sessions significantly helped in developing my critical mindset.
Through this challenge, I not only expanded my design skills but also gained valuable insights into my creative process. The variety of themes, constraints, and daily challenges pushed me beyond my comfort zone, preparing me for future design projects, including my Bachelor’s project.
The data used for this project comes from an API provided by Ergast, which includes information on Formula 1 championships starting from 1950, the year the F1 World Championship began. Ergast often relies on Wikipedia data, and to supplement the race data, Wikipedia's API will also be used. The circuit layouts are sourced from a GitHub repository, though some circuits may not be available. The world map used in the project is from the Leaflet Providers GitHub repository, with maps viewable here.
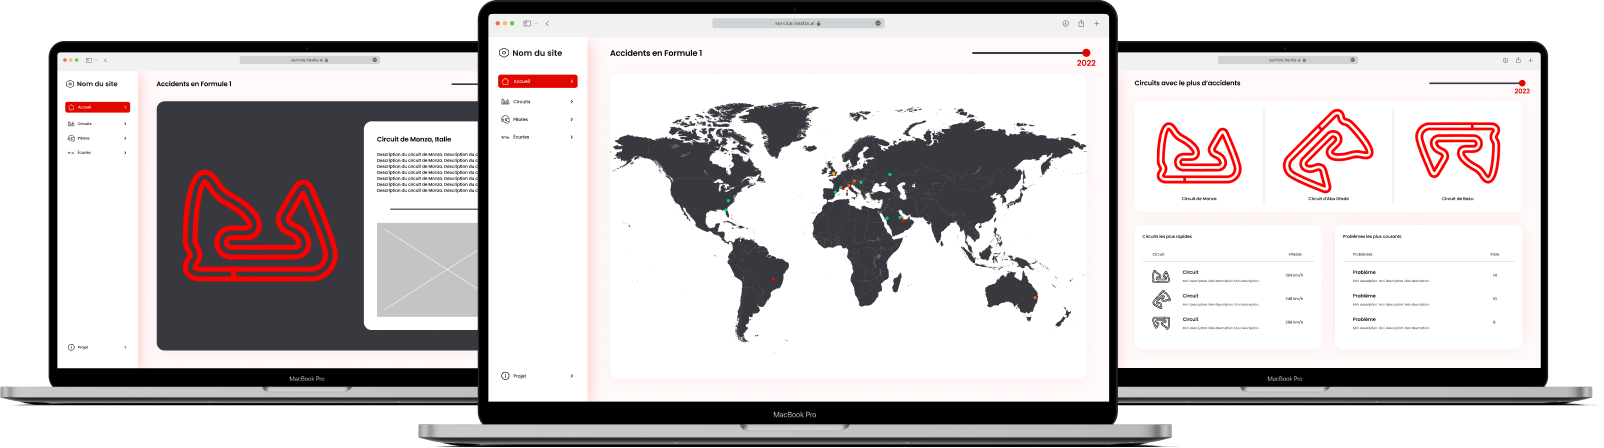
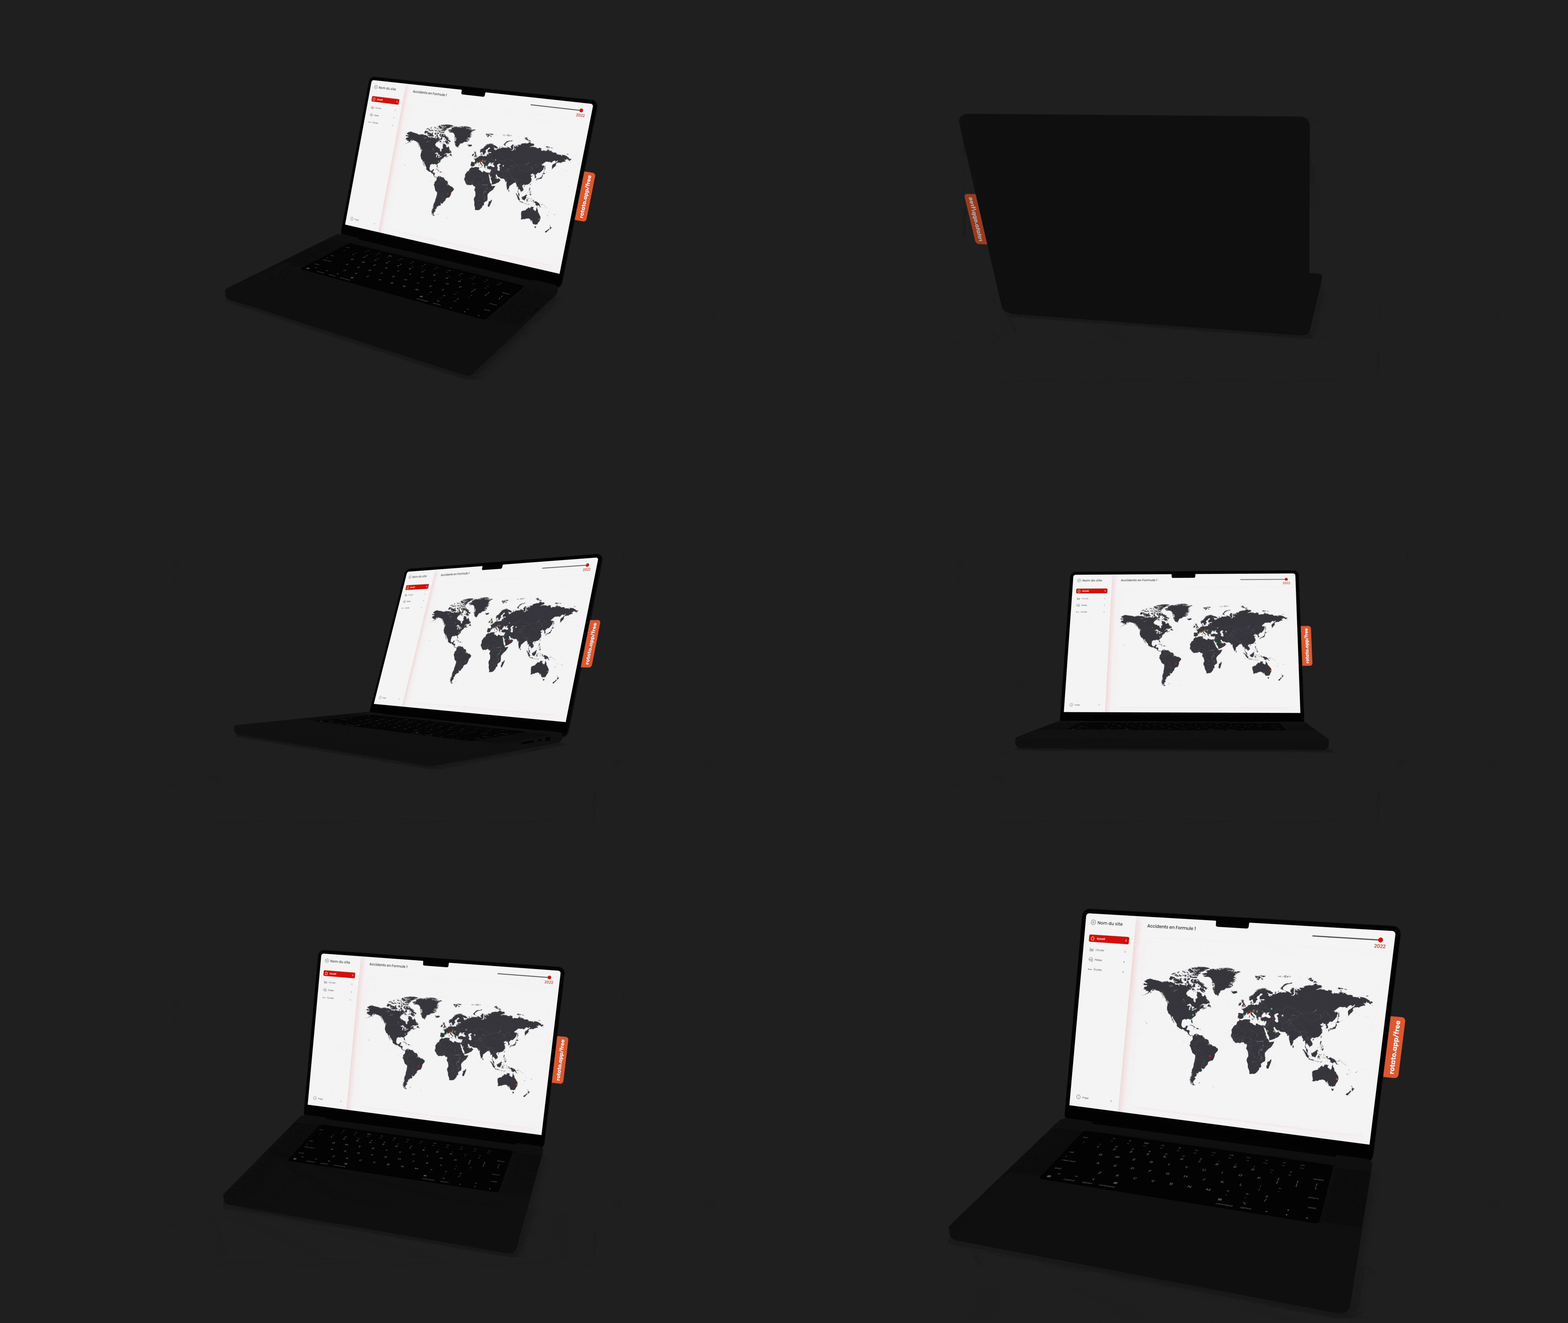
In this phase, I implemented the data visualizations using JavaScript and D3. I used these technologies to transform the data into interactive charts and graphics that help uncover insights from the F1 data. The dynamic visualizations allow users to explore and analyze correlations between various factors like circuit characteristics and accidents. You can view the project live at f1.adrianamota.ch.
The marketing team conducted a market study to identify businesses and organizations interested in ecological initiatives. This analysis helped us understand the needs and expectations of potential partners who could support or fund the project. The resulting business personas represented entities committed to sustainability, looking for interactive tools to raise awareness about the United Nations' Sustainable Development Goals (SDGs).
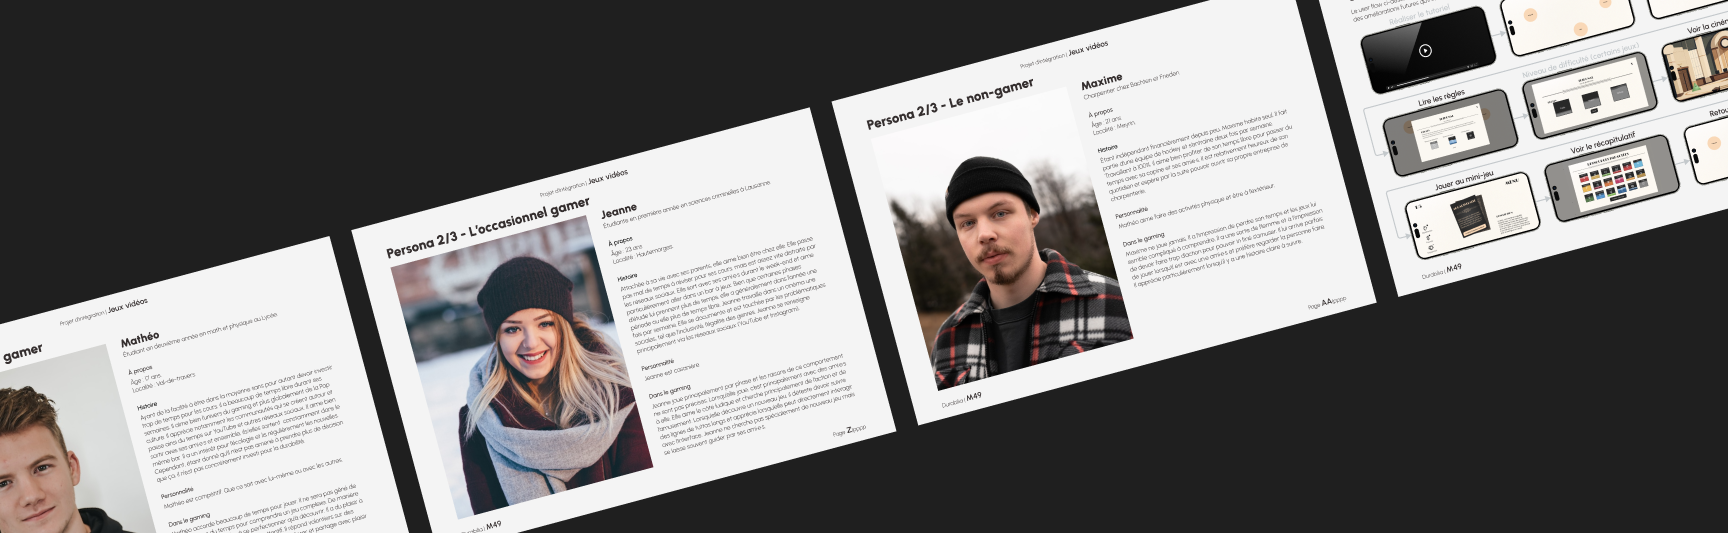
At the same time, we carried out user research focused on the future players of the mini-games. Unlike the business personas created for the market study, these UX personas represented the product's end users. Through interviews, behavioral analyses, and qualitative surveys, we identified different player types, their motivations, gaming habits, and their connection to sustainability issues. These insights guided the user experience design, ensuring an engaging and intuitive interaction with the mini-games.
The identification of key challenges was based on the findings from our user research. We mapped out the main obstacles faced by our target audience, such as limited access to sustainability information or the lack of engaging interactive tools to promote awareness. These observations were instrumental in defining the core features to be integrated into the project’s design.
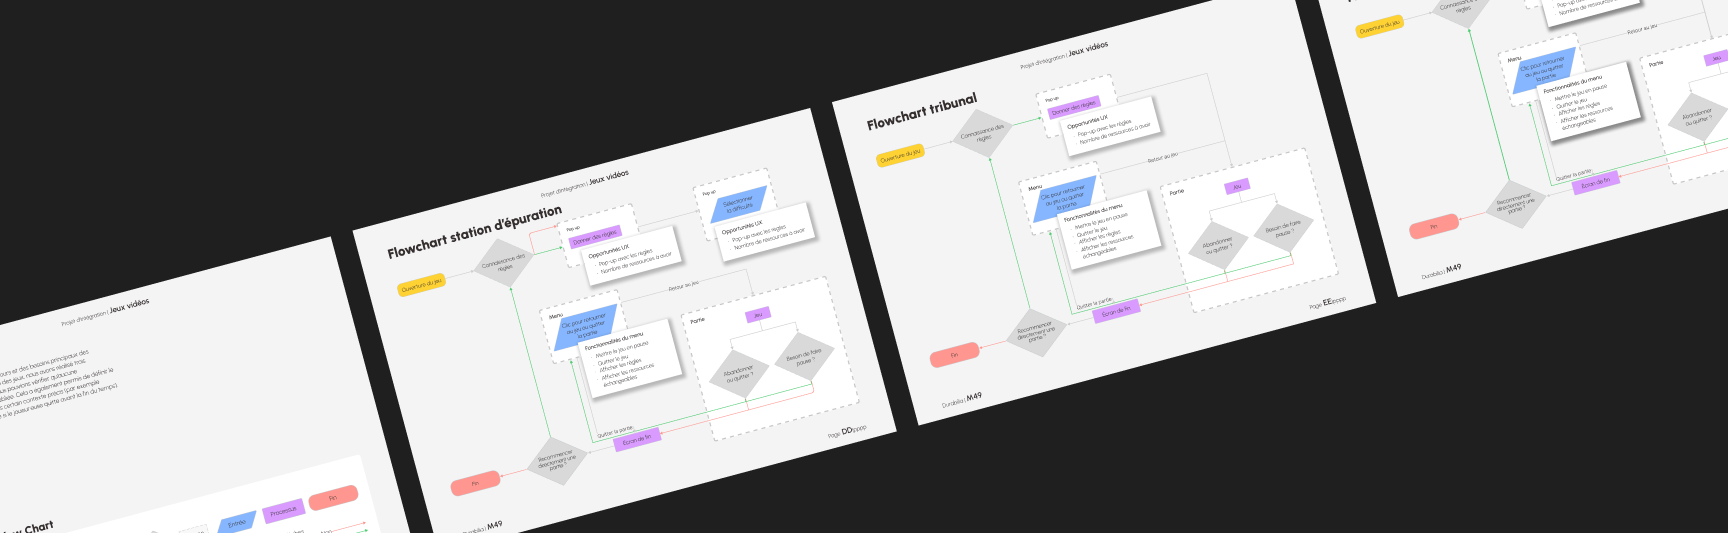
We created flowcharts to visually represent the game mechanics and player interactions. These diagrams helped us break down the complex processes inherent in our multi-layered gameplay - from managing random events and time constraints to navigating the evolution of the player’s avatar. The flowcharts were instrumental in identifying potential bottlenecks and ensuring that every element of the user journey was logically structured and seamlessly integrated into the overall design.
Collaboration was key to the project’s success, involving a concerted effort in marketing strategy, development, and project management. Our marketing team devised a targeted strategy to position the game as an innovative tool for sustainability awareness, while the development team worked diligently on both front-end and back-end implementations to bring the game mechanics to life. Simultaneously, robust project management ensured effective communication and coordination across all teams, aligning technical execution with the creative vision and strategic objectives.
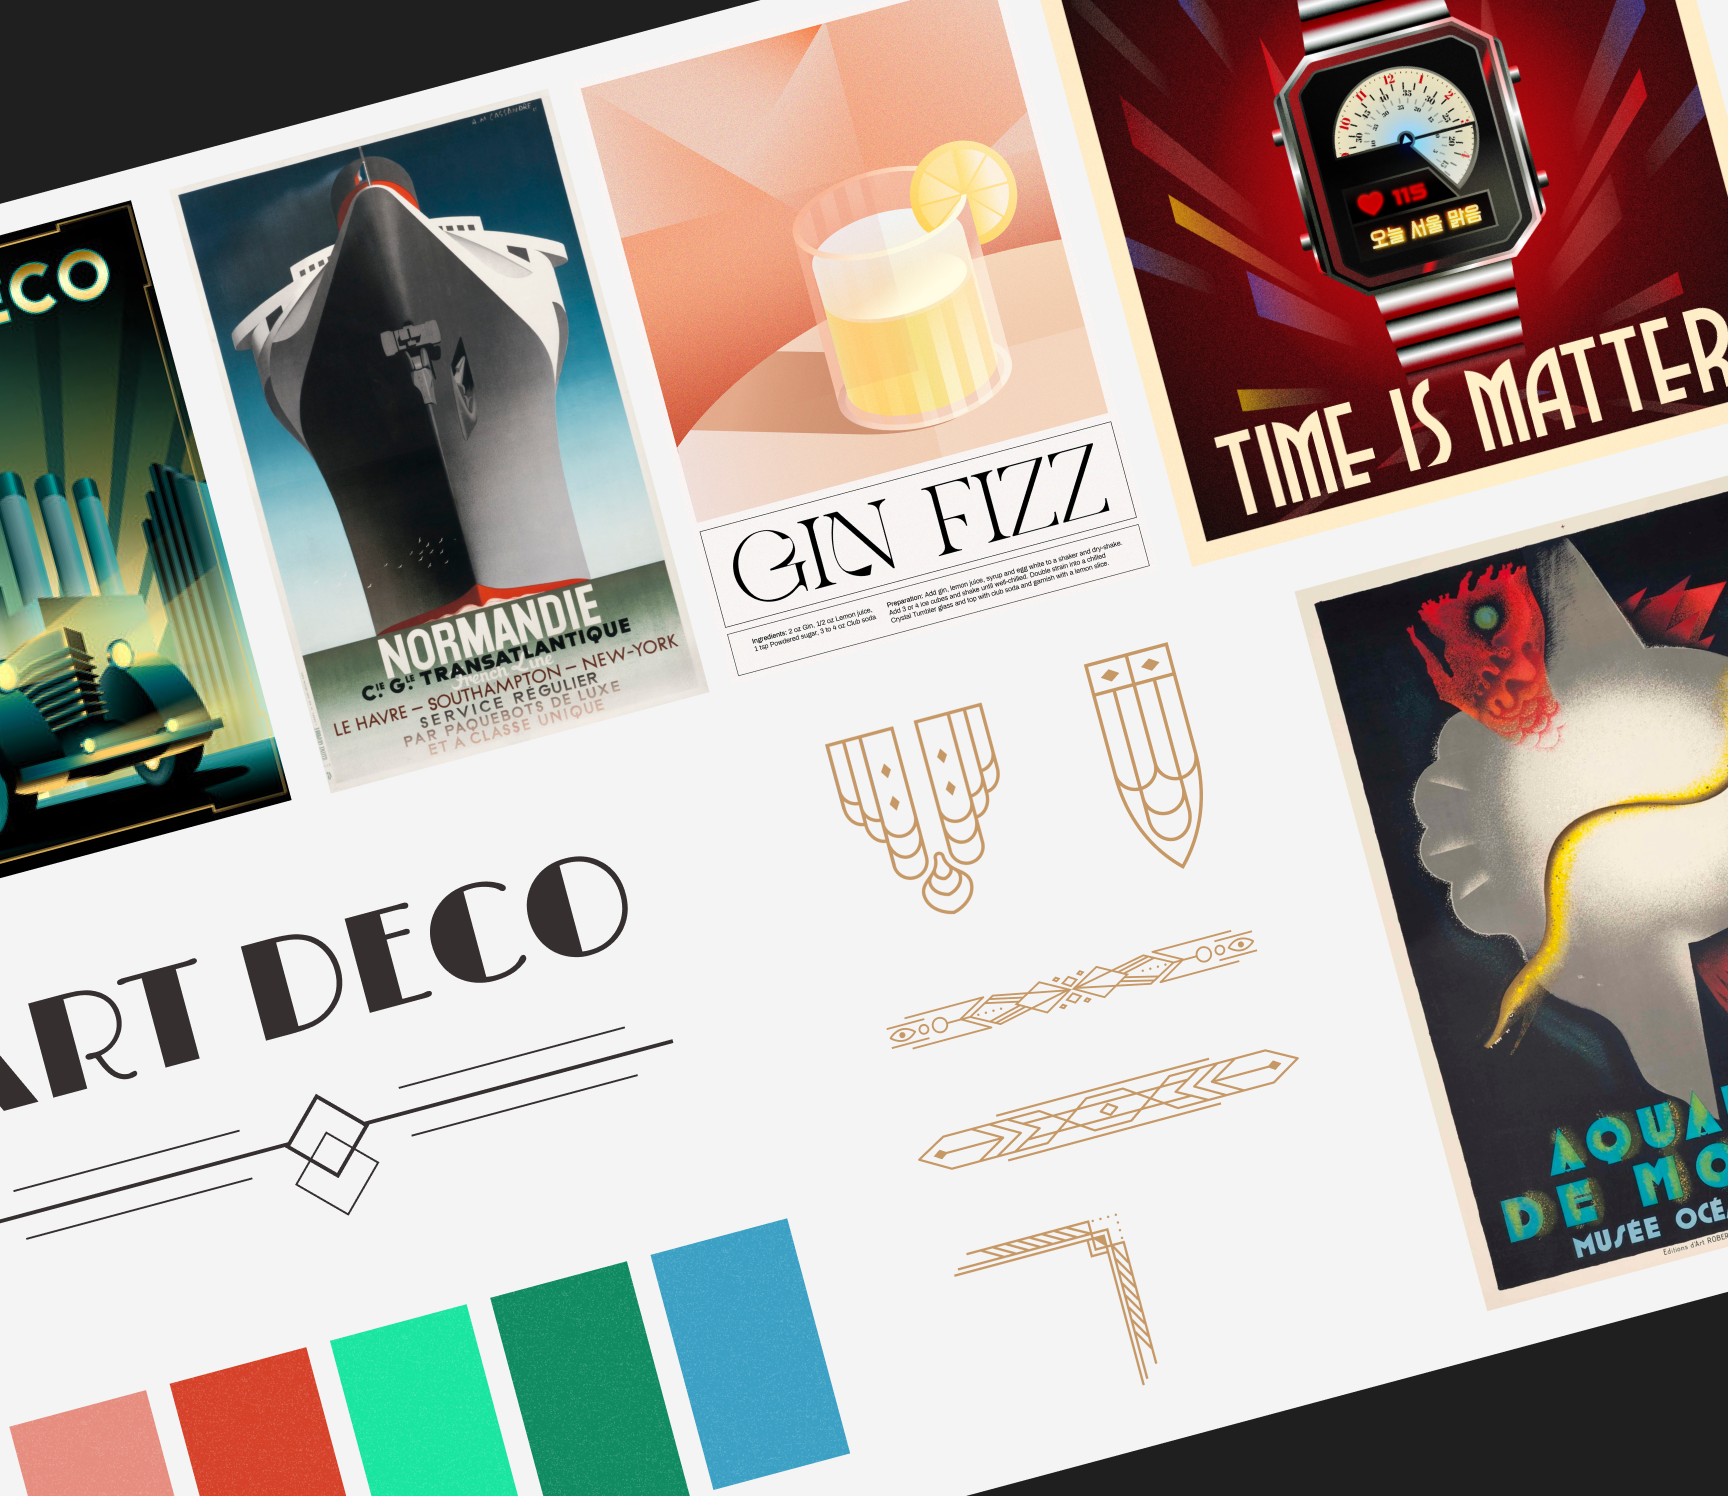
We began by creating a comprehensive moodboard that captured the desired art deco aesthetic, drawing inspiration from geometric designs, luxurious metallic hues, and a modern twist achieved through subtle texturing. This moodboard set the emotional and visual tone for the project, ensuring that all subsequent design decisions resonated with the theme of sustainability and elegance.
Building on the moodboard, we developed detailed graphic charters that defined our project's visual identity. These charters established guidelines for typography, color palettes, and overall visual language, ensuring consistency across all interfaces. In addition to defining the artistic direction, we outlined key UI components and visual elements, such as buttons, icons, and interactive components, ensuring they aligned with the chosen aesthetic. These guidelines served as a reference for both designers and developers, providing a cohesive framework to maintain the Art Deco style while integrating modern design principles.
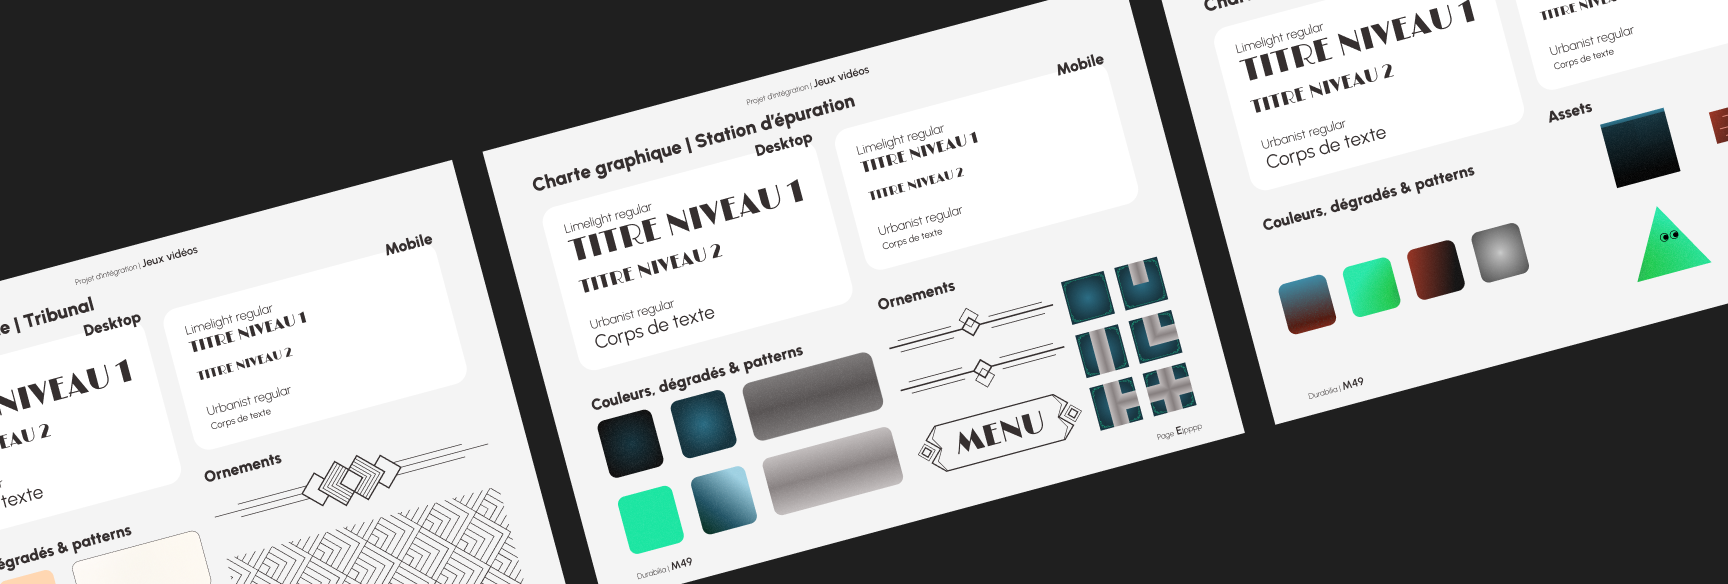
Instead of designing custom icons, we conducted in-depth research to identify a set of existing icons that aligned with our visual identity. This approach ensured graphic consistency while optimizing production time. The selected icons adhered to our aesthetic choices in terms of shapes, styles, and overall harmony with the project's other visual elements.
To enrich the narrative and immerse players in the world of Flatlandia, cinematic sequences were integrated into the game. These cinematics provided context and storytelling that linked gameplay mechanics with the overarching theme of evolving consciousness and sustainability, creating a more engaging and memorable experience.
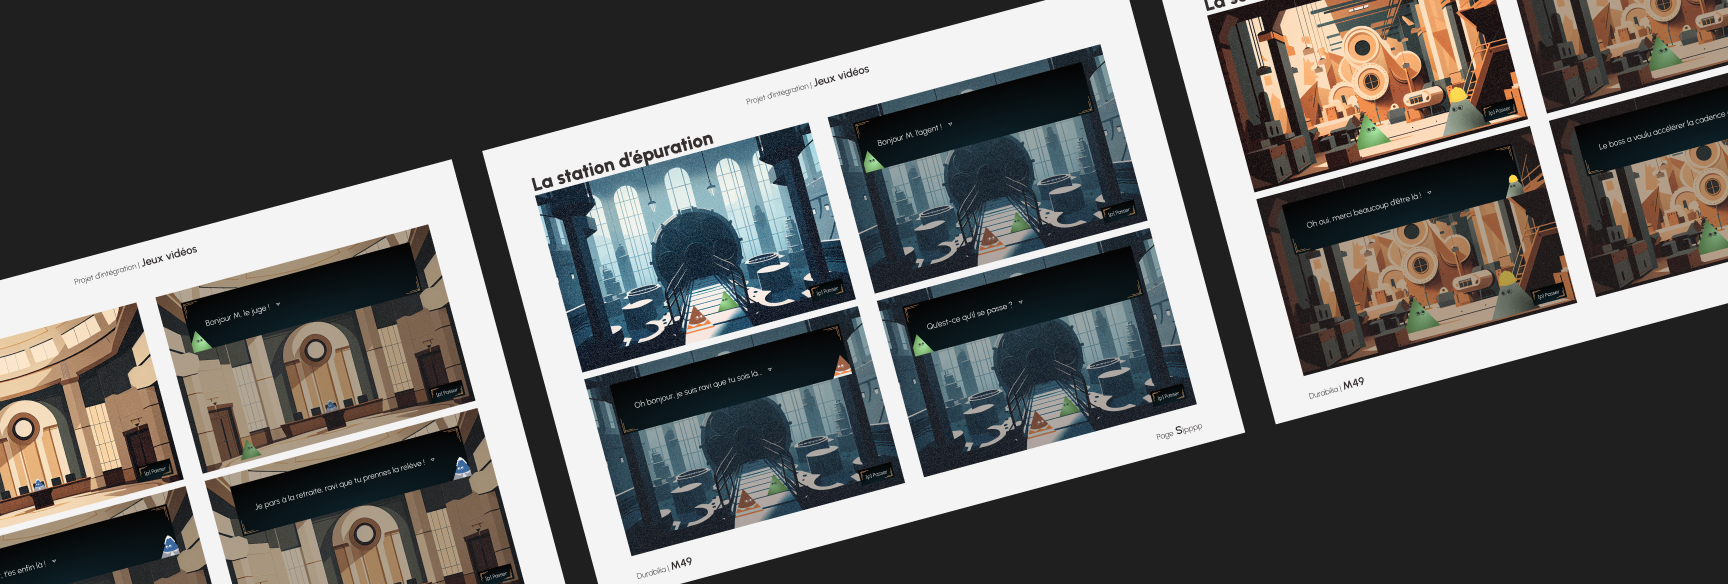
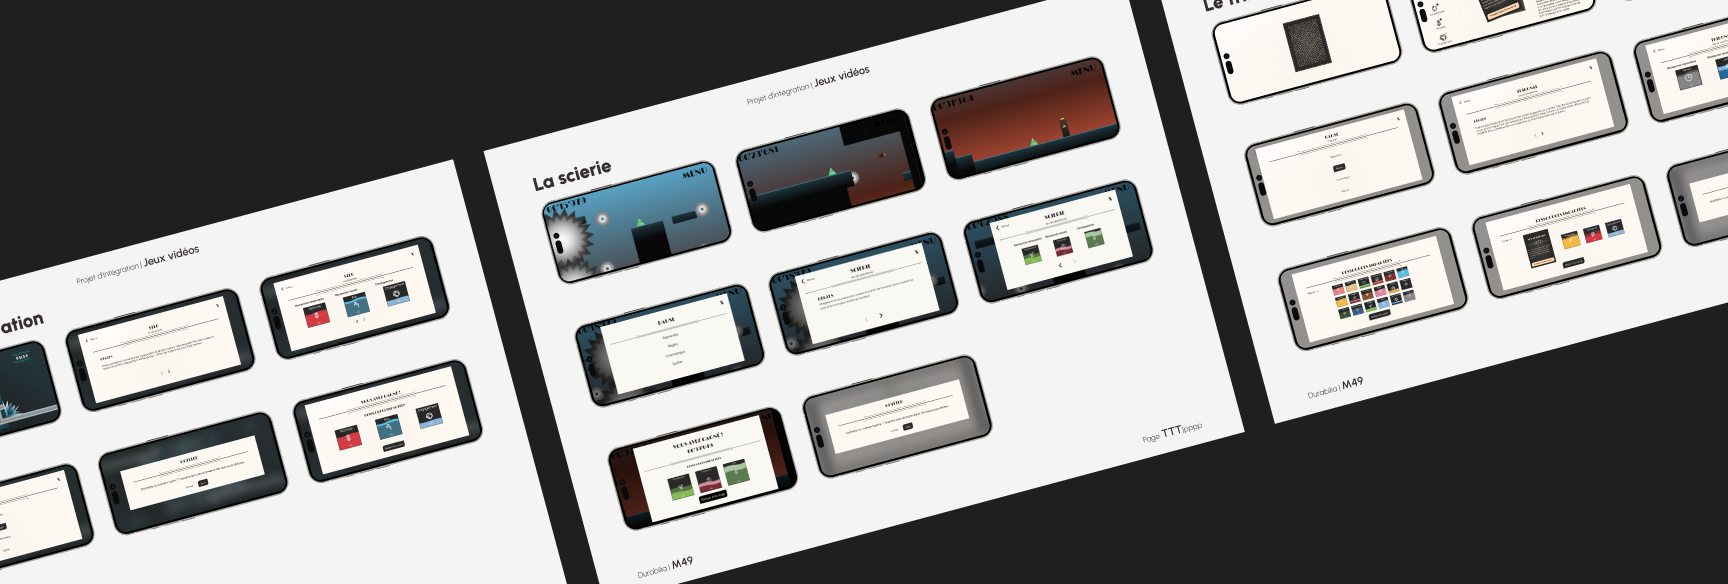
We progressed from conceptual sketches to high-fidelity mockups that showcased the polished, final look of the game interfaces. Emphasizing a mobile-first approach initially, these high-fidelity designs were carefully refined to capture the intricate details of the art deco style while ensuring usability and visual appeal on both mobile and desktop platforms.
User testing was conducted to evaluate the usability and overall experience of the game. Structured sessions, including pre- and post-test questionnaires and the System Usability Scale (SUS), were employed alongside eye-tracking analyses to gather quantitative and qualitative insights. This feedback was invaluable in identifying friction points and areas for improvement in the user interface and gameplay flow.
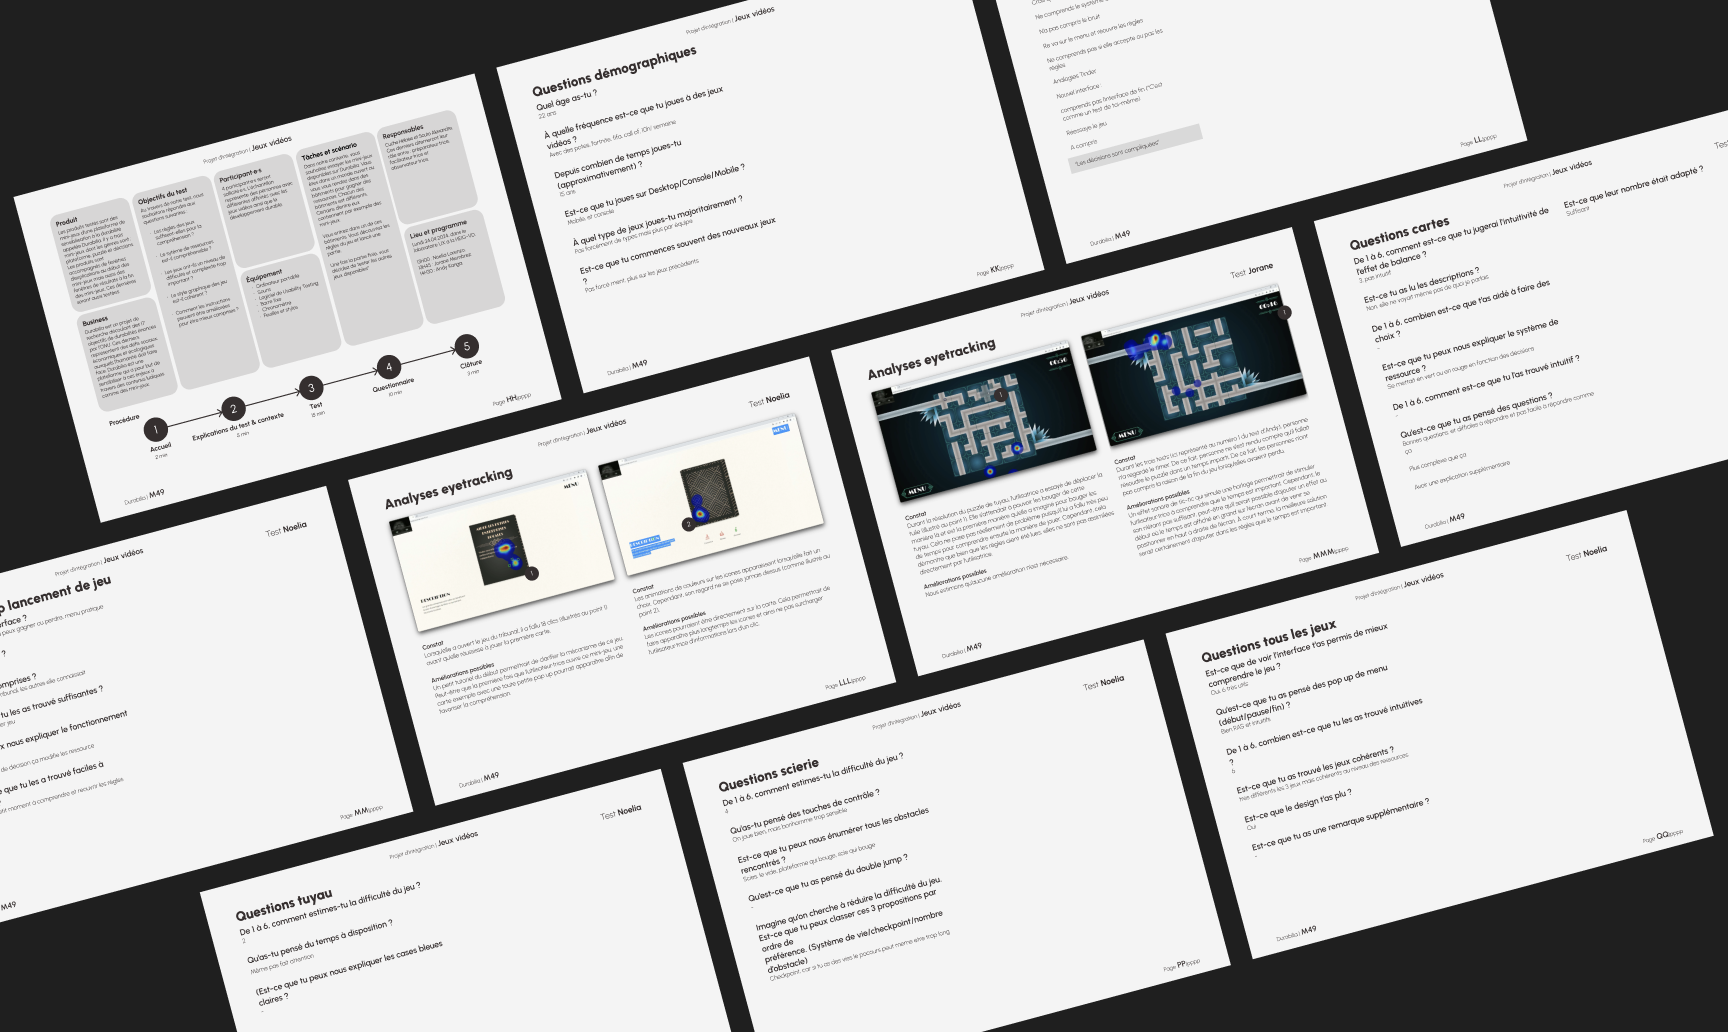
Looking ahead, there are several avenues for enhancing the project. Potential improvements include expanding game mechanics, deepening narrative elements, and refining the interface for even greater clarity and engagement. Exploring additional features such as difficulty levels, customizable elements, and broader platform compatibility could further elevate the player experience.
The project was not without its challenges. Time constraints necessitated extra working hours, and technical hurdles - such as the integration between front-end and back-end systems - required additional support and collaboration. Coordination between the UX/UI team and the development team initially presented difficulties, but regular meetings and improved communication helped to mitigate these issues. Moreover, adapting to evolving client requirements and managing a diverse range of stakeholder needs tested our flexibility and resourcefulness.
Ultimately, the project successfully delivered a series of engaging mini video games that blend the art deco aesthetic with meaningful sustainability themes. Despite the challenges faced, the collaborative efforts of the team led to a cohesive and polished final product. The experience underscored the importance of clear communication, iterative design, and the willingness to adapt - lessons that will undoubtedly inform future projects in the realm of interactive media and sustainability.
For this phase, several activities were conducted to better understand the needs and expectations of the users. A user mapping was created to visualize the different user profiles and their interactions with the system. An empathy mapwas also developed to gain a deeper understanding of the emotions, needs, and motivations of the users. Additionally, the Jobs-to-be-done method was applied to identify the specific tasks each user must accomplish and the challenges they face in completing those tasks. Qualitative interviews were conducted with representatives from three target user groups: students, teachers, and administrative staff, to gather direct feedback and better understand their expectations regarding the schedule consultation system. These activities helped define the priorities for the project’s development, taking into account the specific needs of each user group.
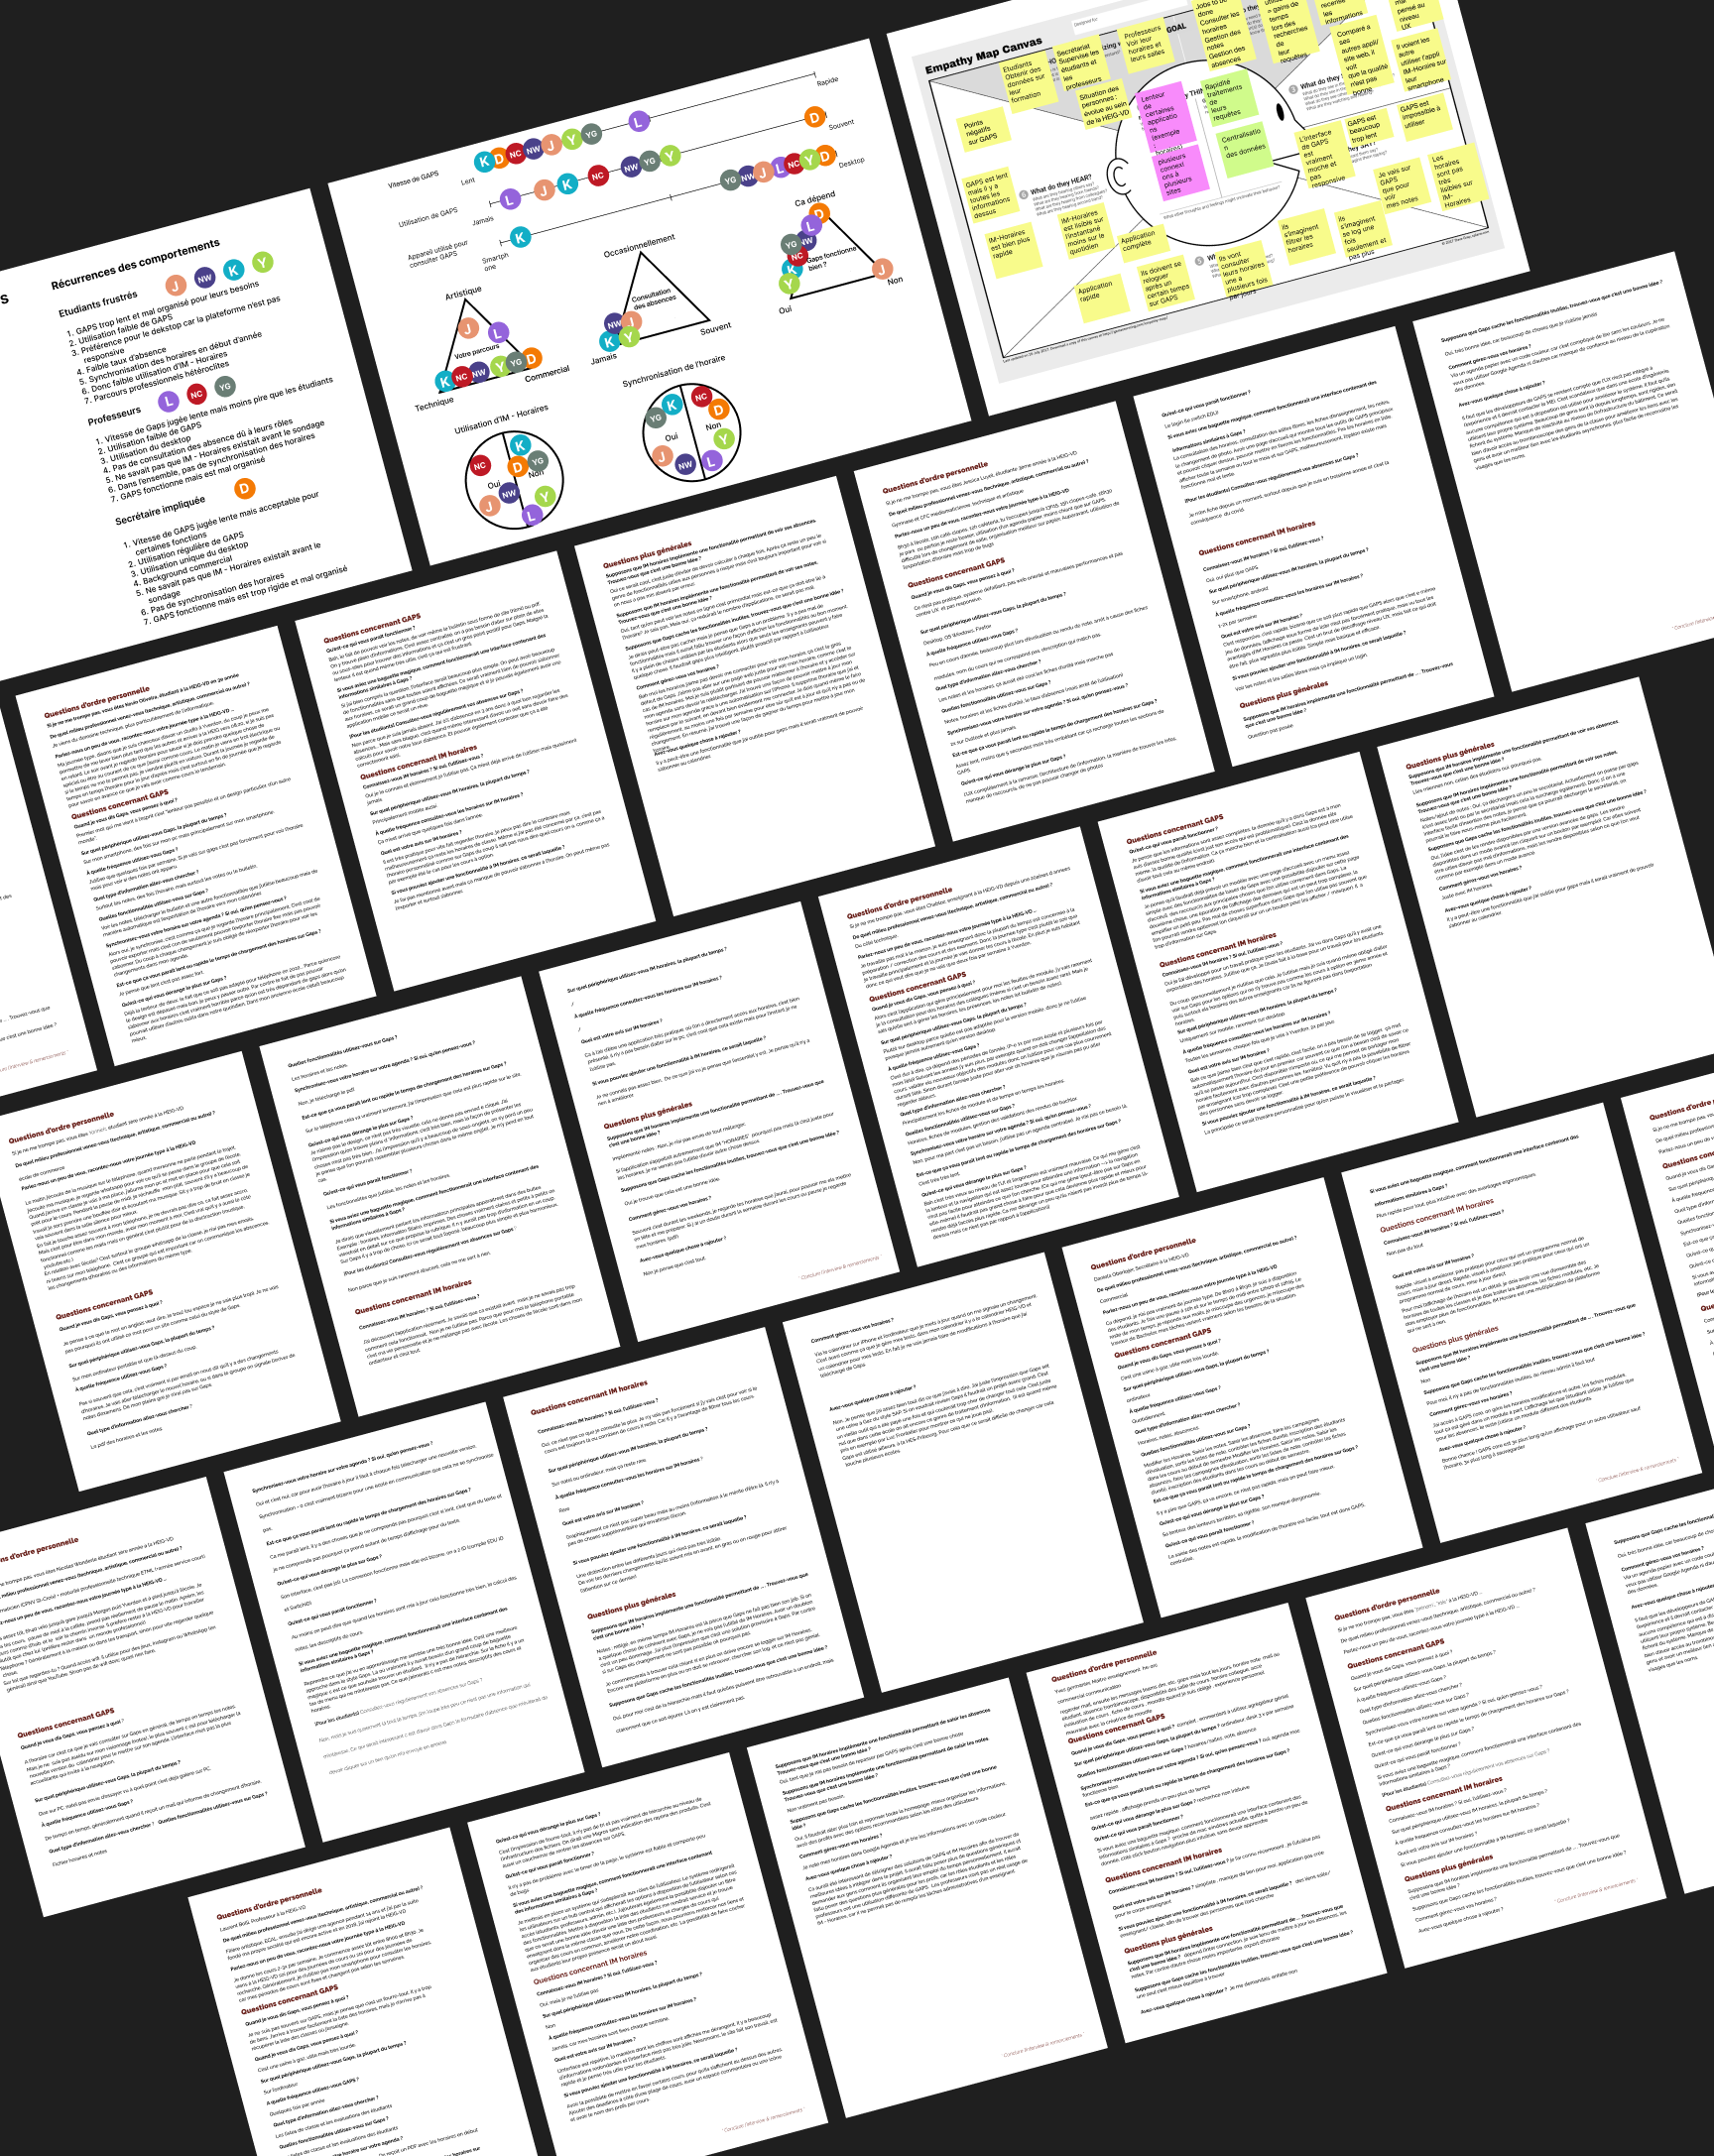
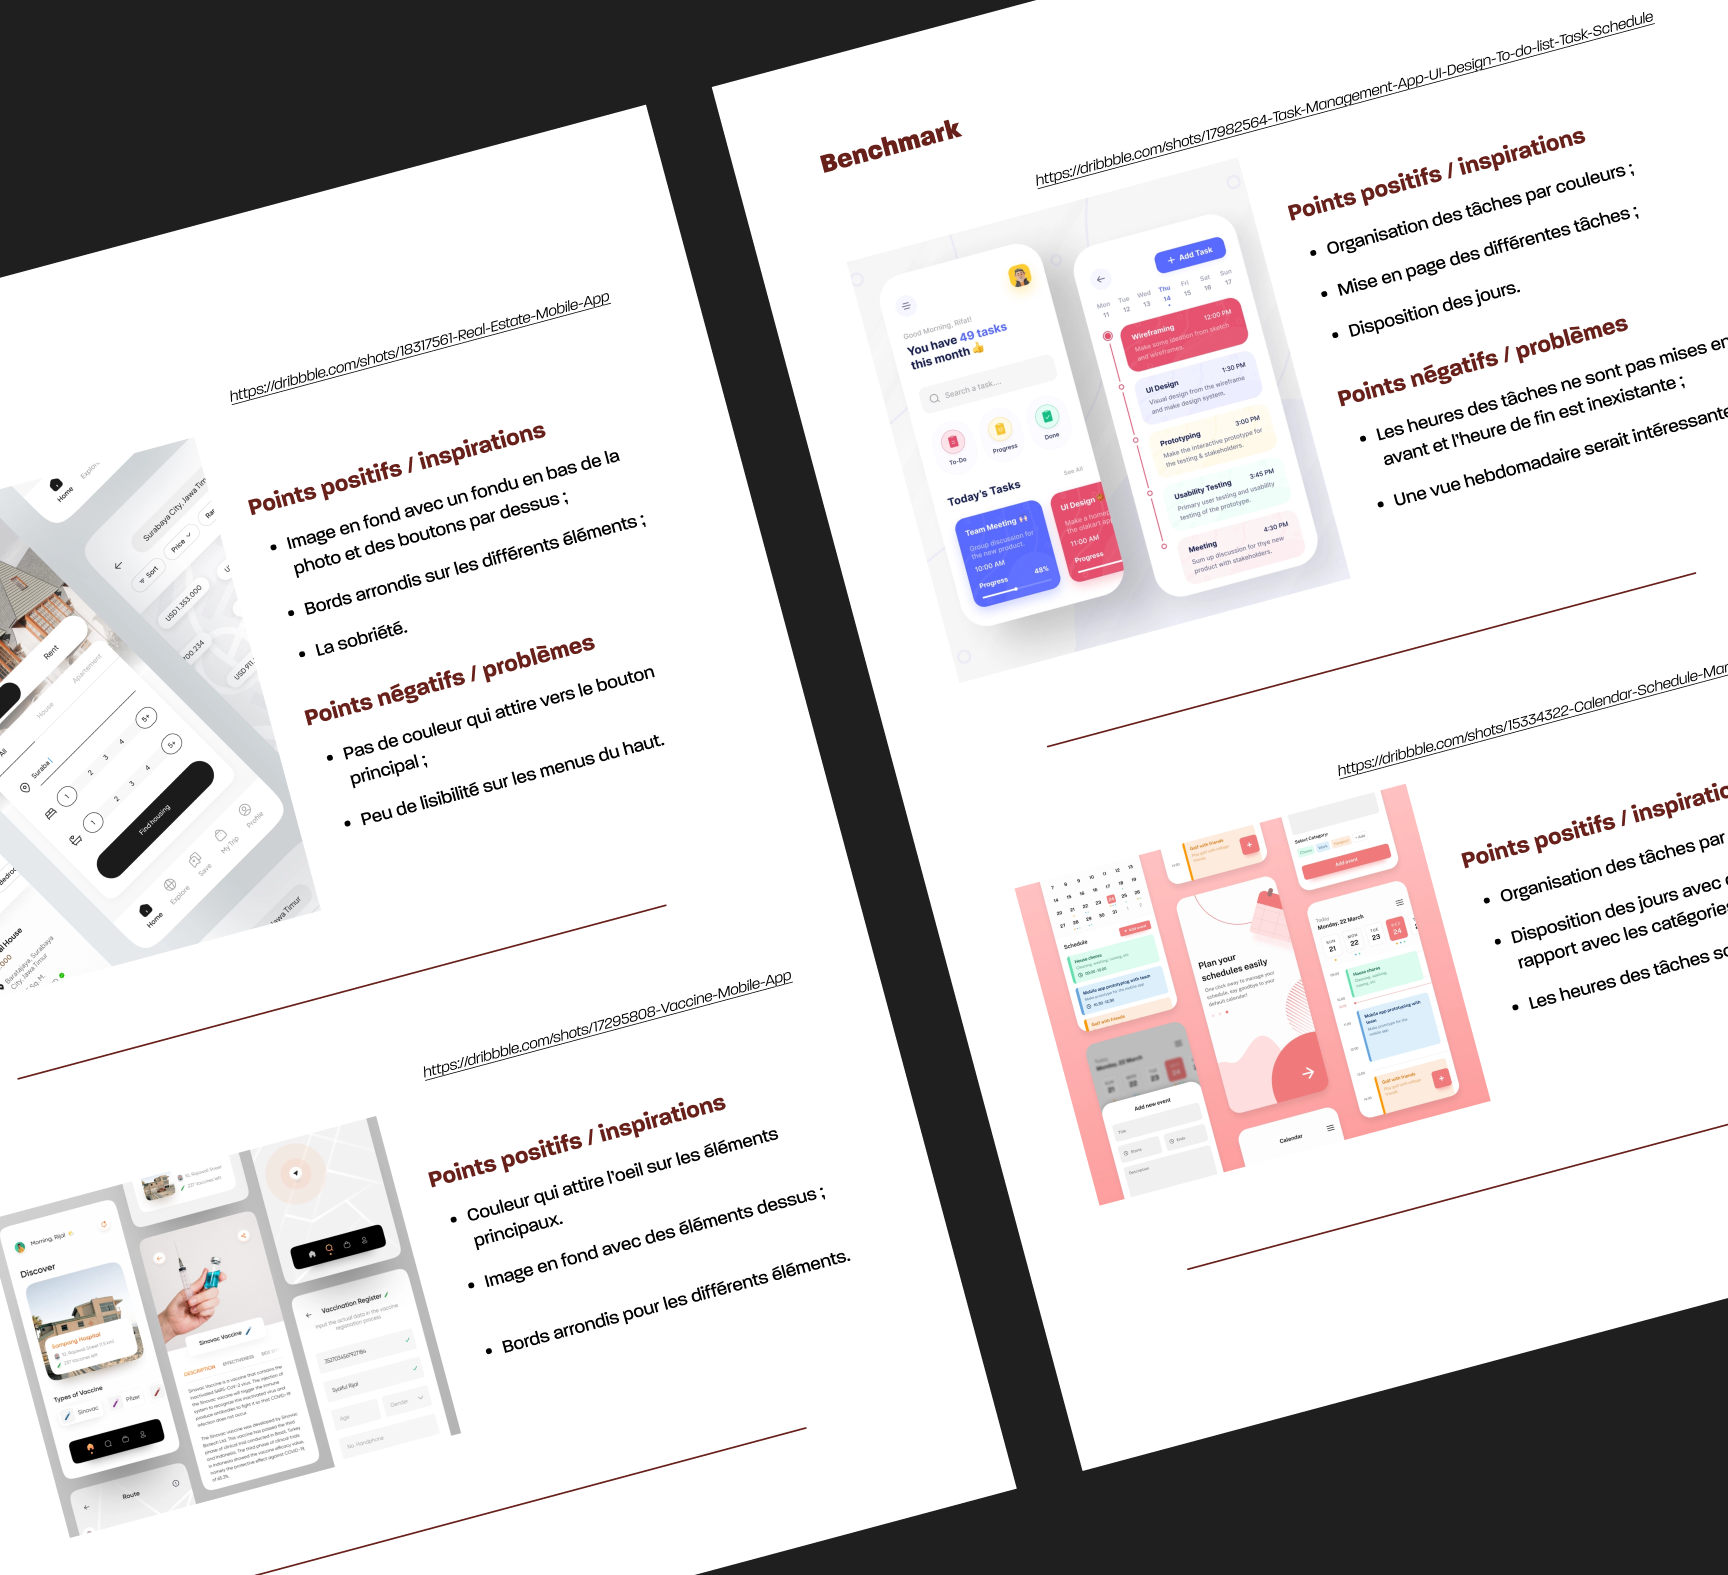
We conducted a benchmark of other online calendar applications to evaluate their strengths and weaknesses. This allowed us to identify best practices and potential areas for improvement. We also focused on identifying problems and needs based on the feedback from the qualitative interviews. By analyzing the pain points and requirements expressed by the users, we gained valuable insights into the key functionalities and features that the system should include to address the challenges faced by students, teachers, and administrative staff.
Since this was a school project, there were times when I had to assist some of my colleagues with data modeling, back-end, and front-end tasks. Although my main focus was on UX/UI design and project management, I collaborated across teams to ensure seamless integration. Additionally, as I was also responsible for project management, I played a key role in facilitating effective communication between the different teams. This ensured that all team members could work efficiently and in sync, helping us stay on track to successfully complete the project.
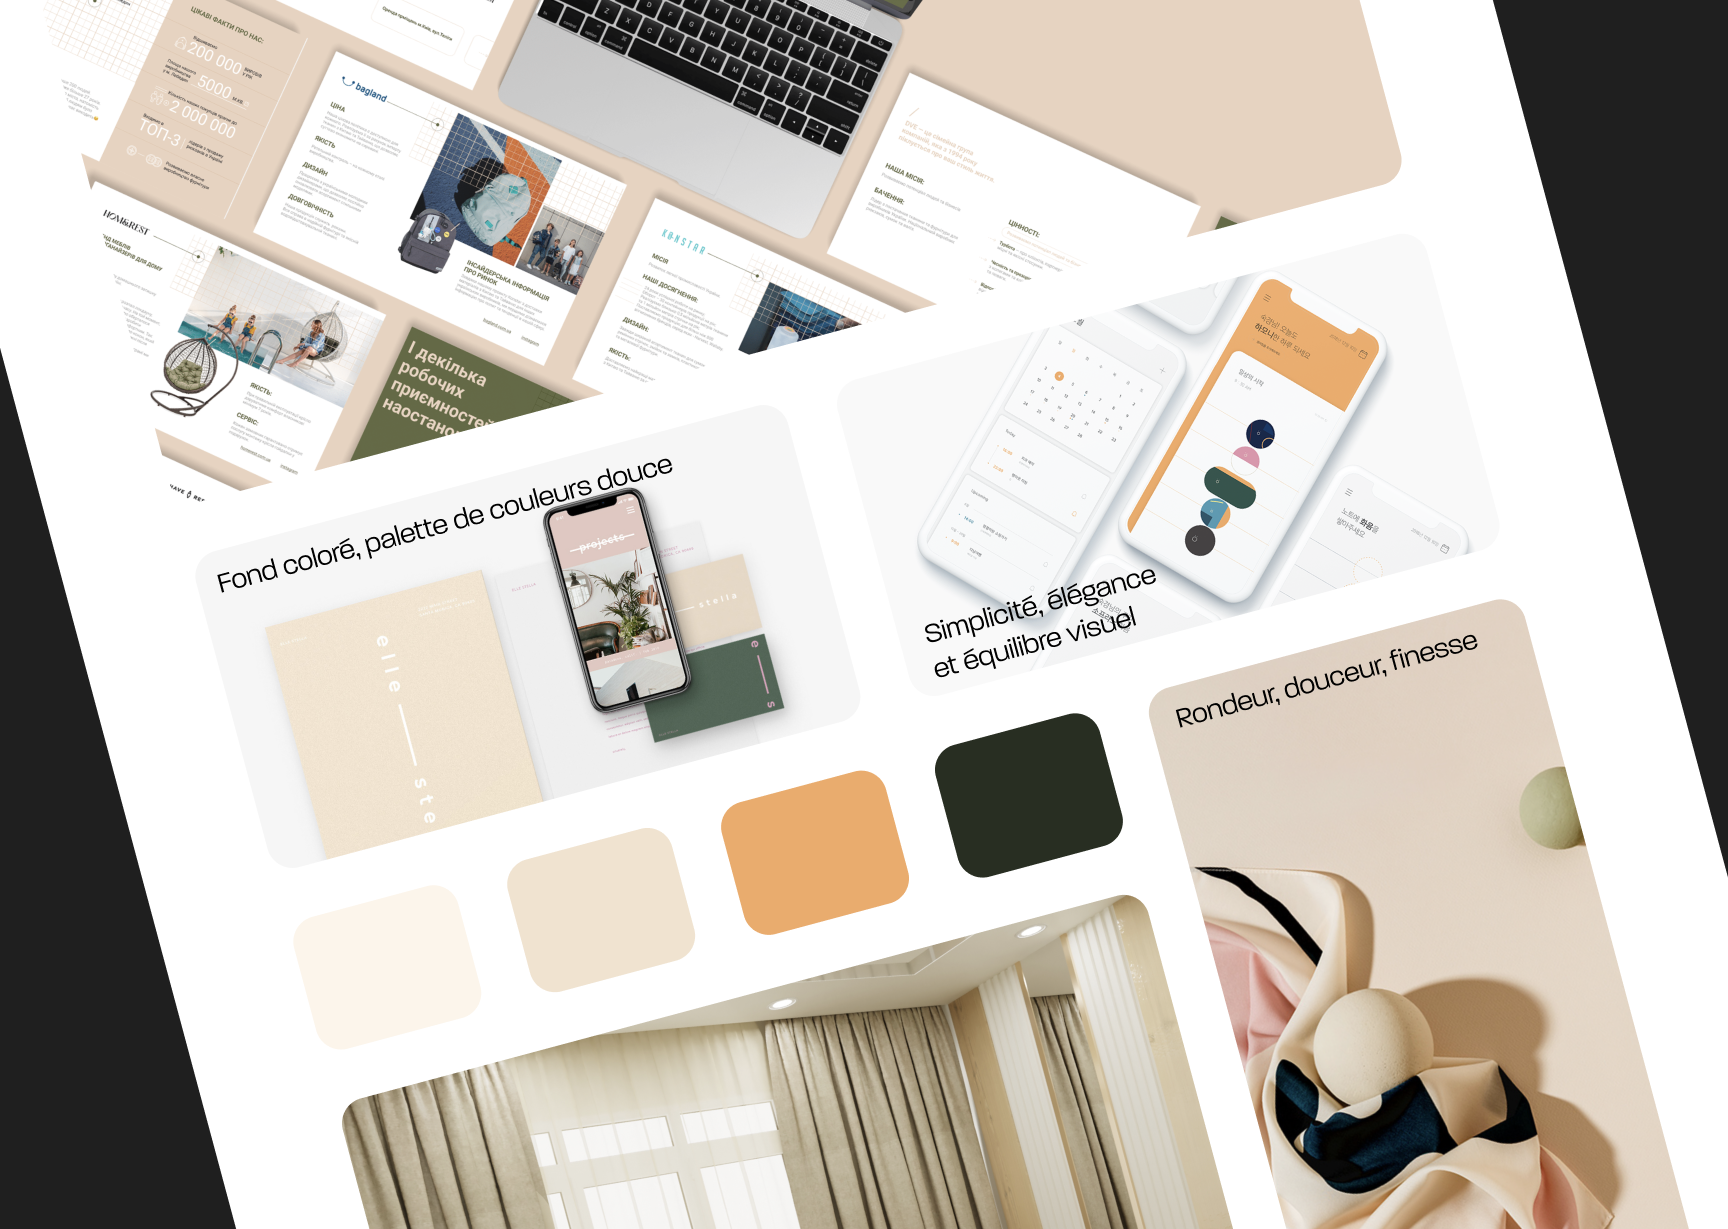
The objective of the moodboard was to establish a cohesive visual language that reflected the project's values. We focused on a soft color palette with warm tones to create a welcoming and calming atmosphere. The design aimed for simplicity, elegance, and visual balance, with rounded shapes and smooth lines to evoke a sense of softness, refinement, and approachability. This ambiance was intended to make the user experience more intuitive and pleasant, creating a harmonious environment for all users interacting with the system.
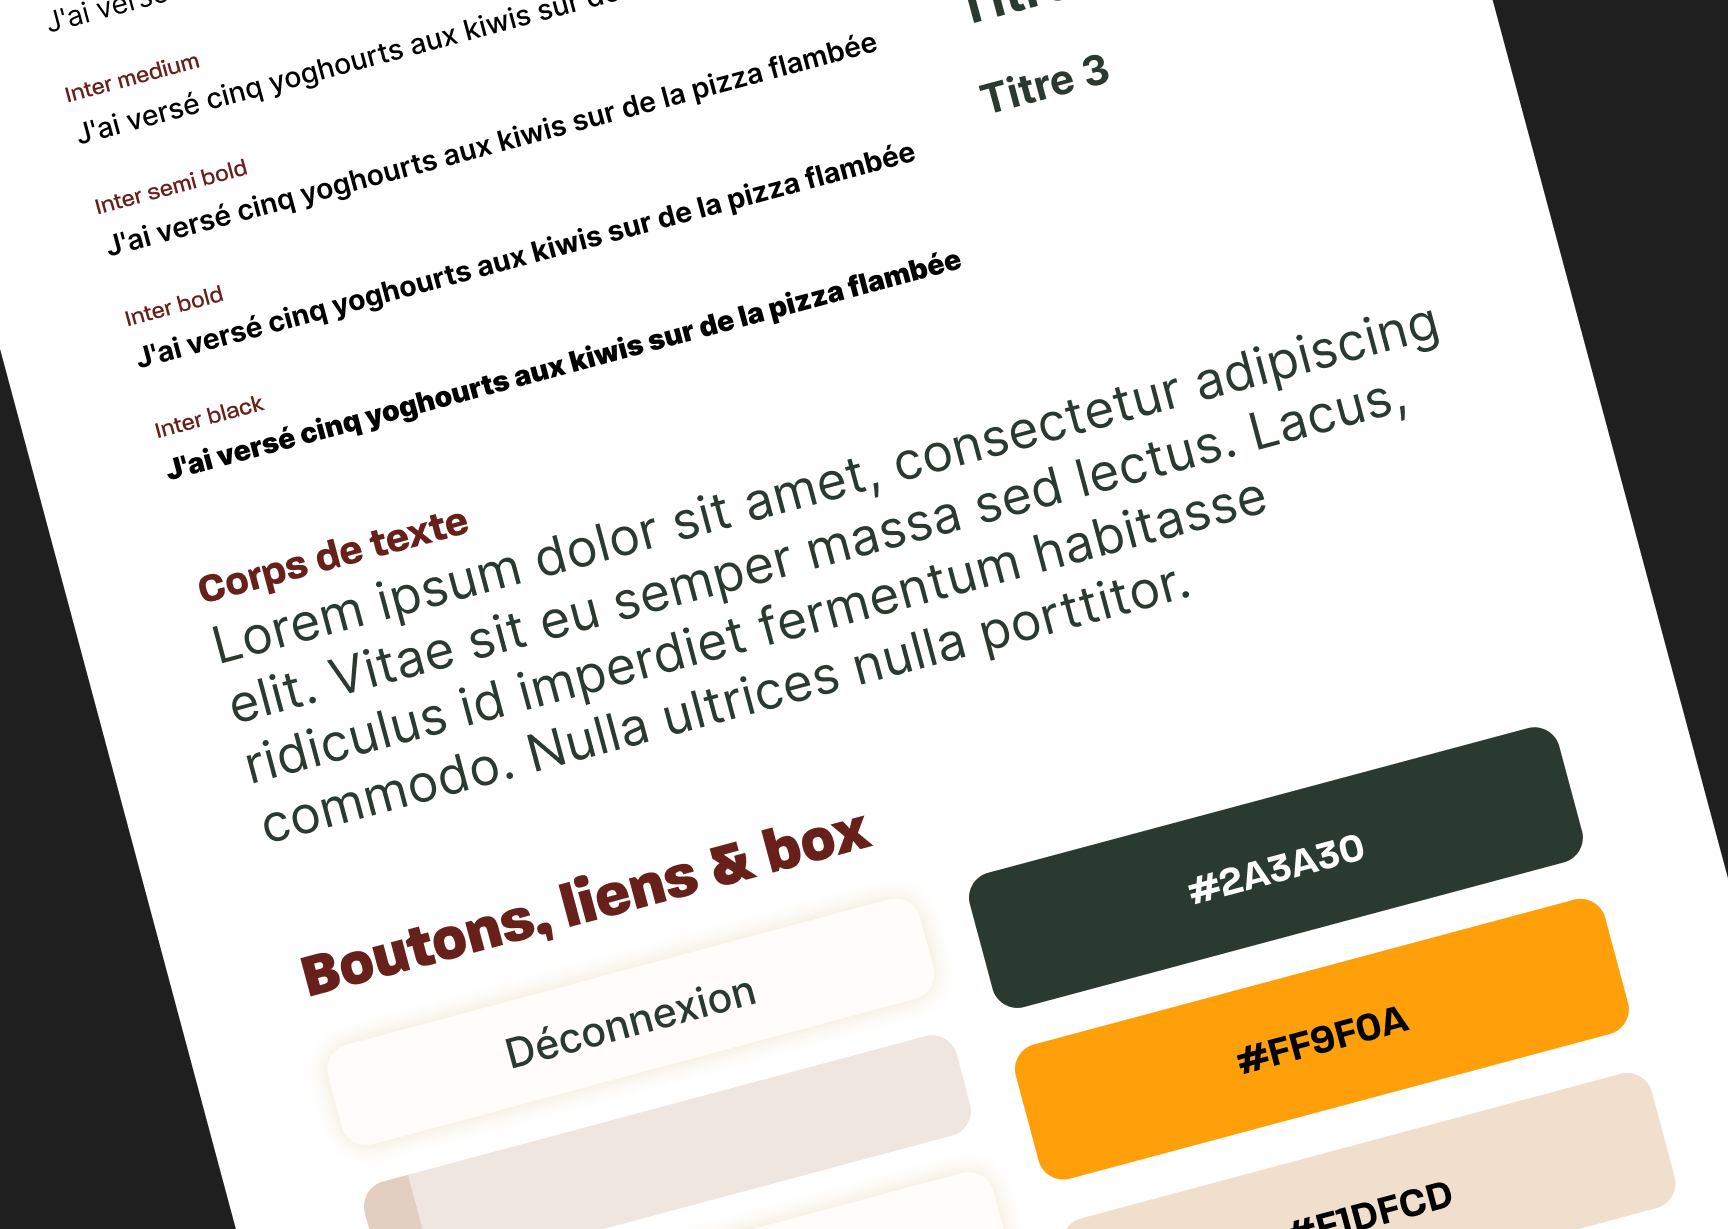
The graphic charter defines the visual identity of the project, ensuring strong visual coherence across all interfaces, whether on desktop or mobile. It is structured around several key elements, including the selected typography, color palette, and the design of links, boxes, and call-to-action elements. These elements work together to establish a unified and consistent visual language, creating a seamless and intuitive experience for users throughout the platform.
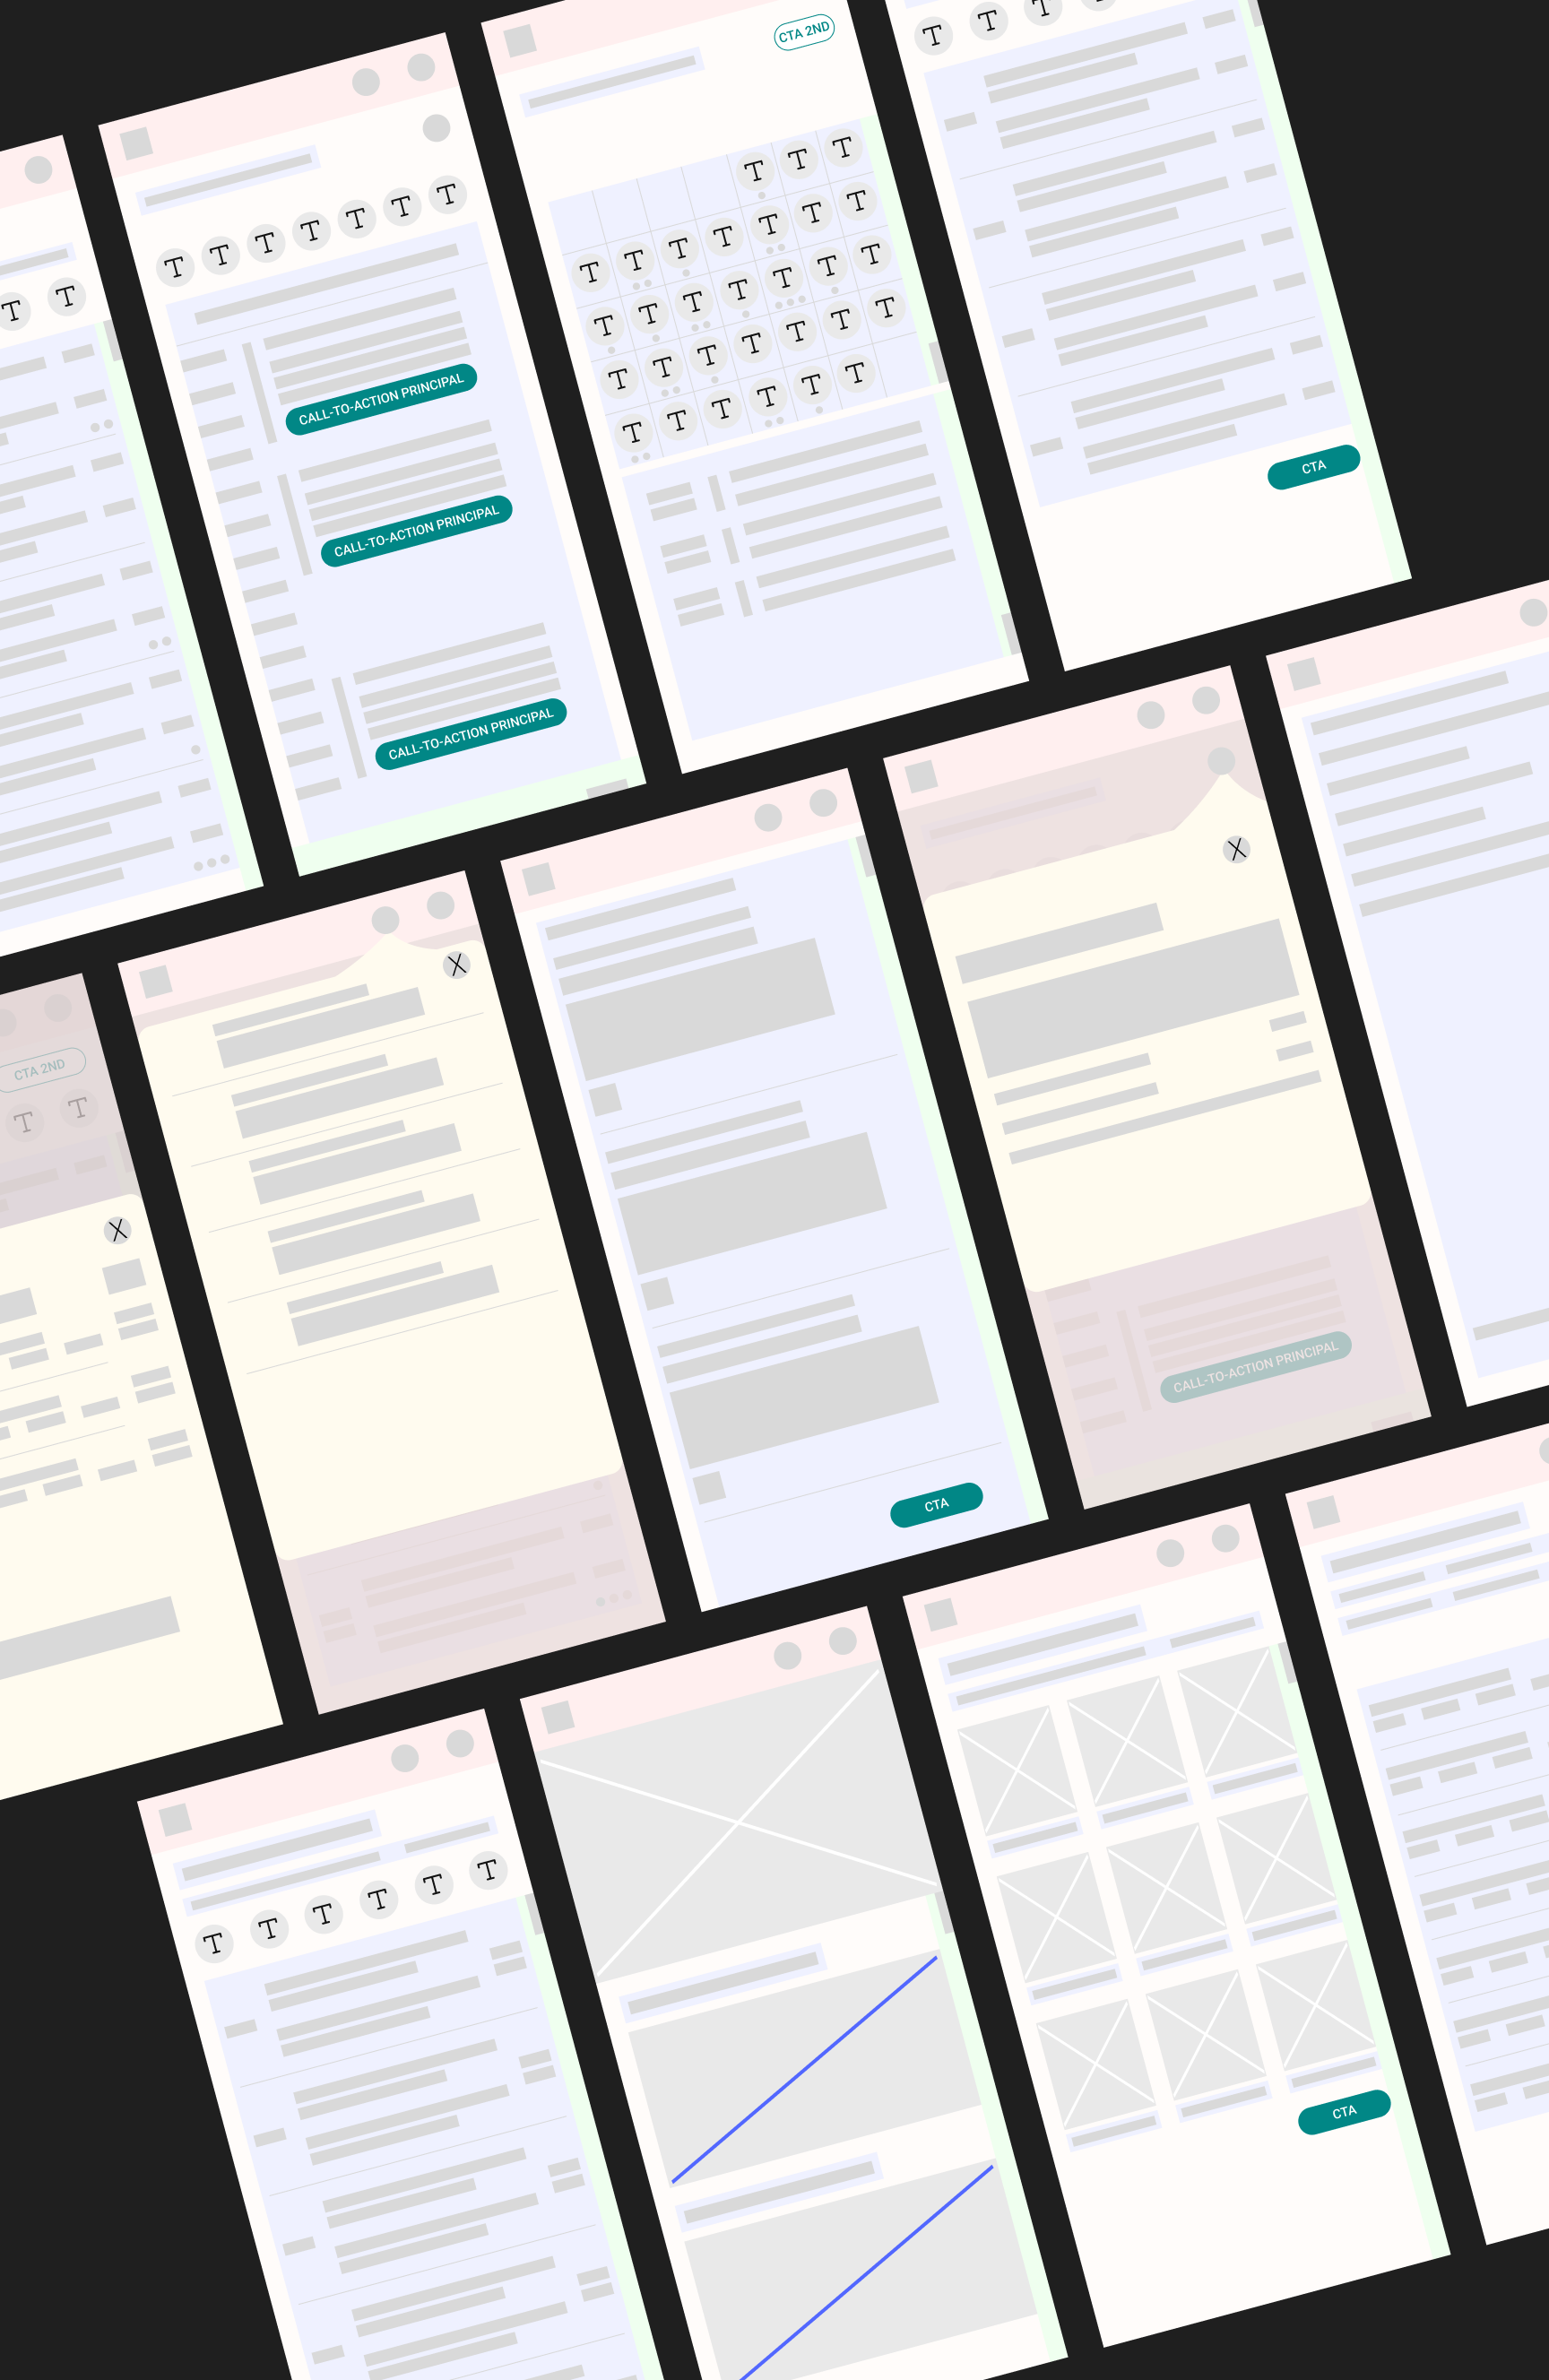
We started by creating low-fidelity mockups with a mobile-first approach. This was essential because it allowed us to focus on the layout and placement of the various functionalities without getting distracted by visual details. Given the number of features to be included in the platform, it was important to establish a clear and logical structure from the beginning. By prioritizing mobile design first, we ensured that the most crucial features were well-organized and easily accessible on smaller screens, providing a strong foundation for the final design.
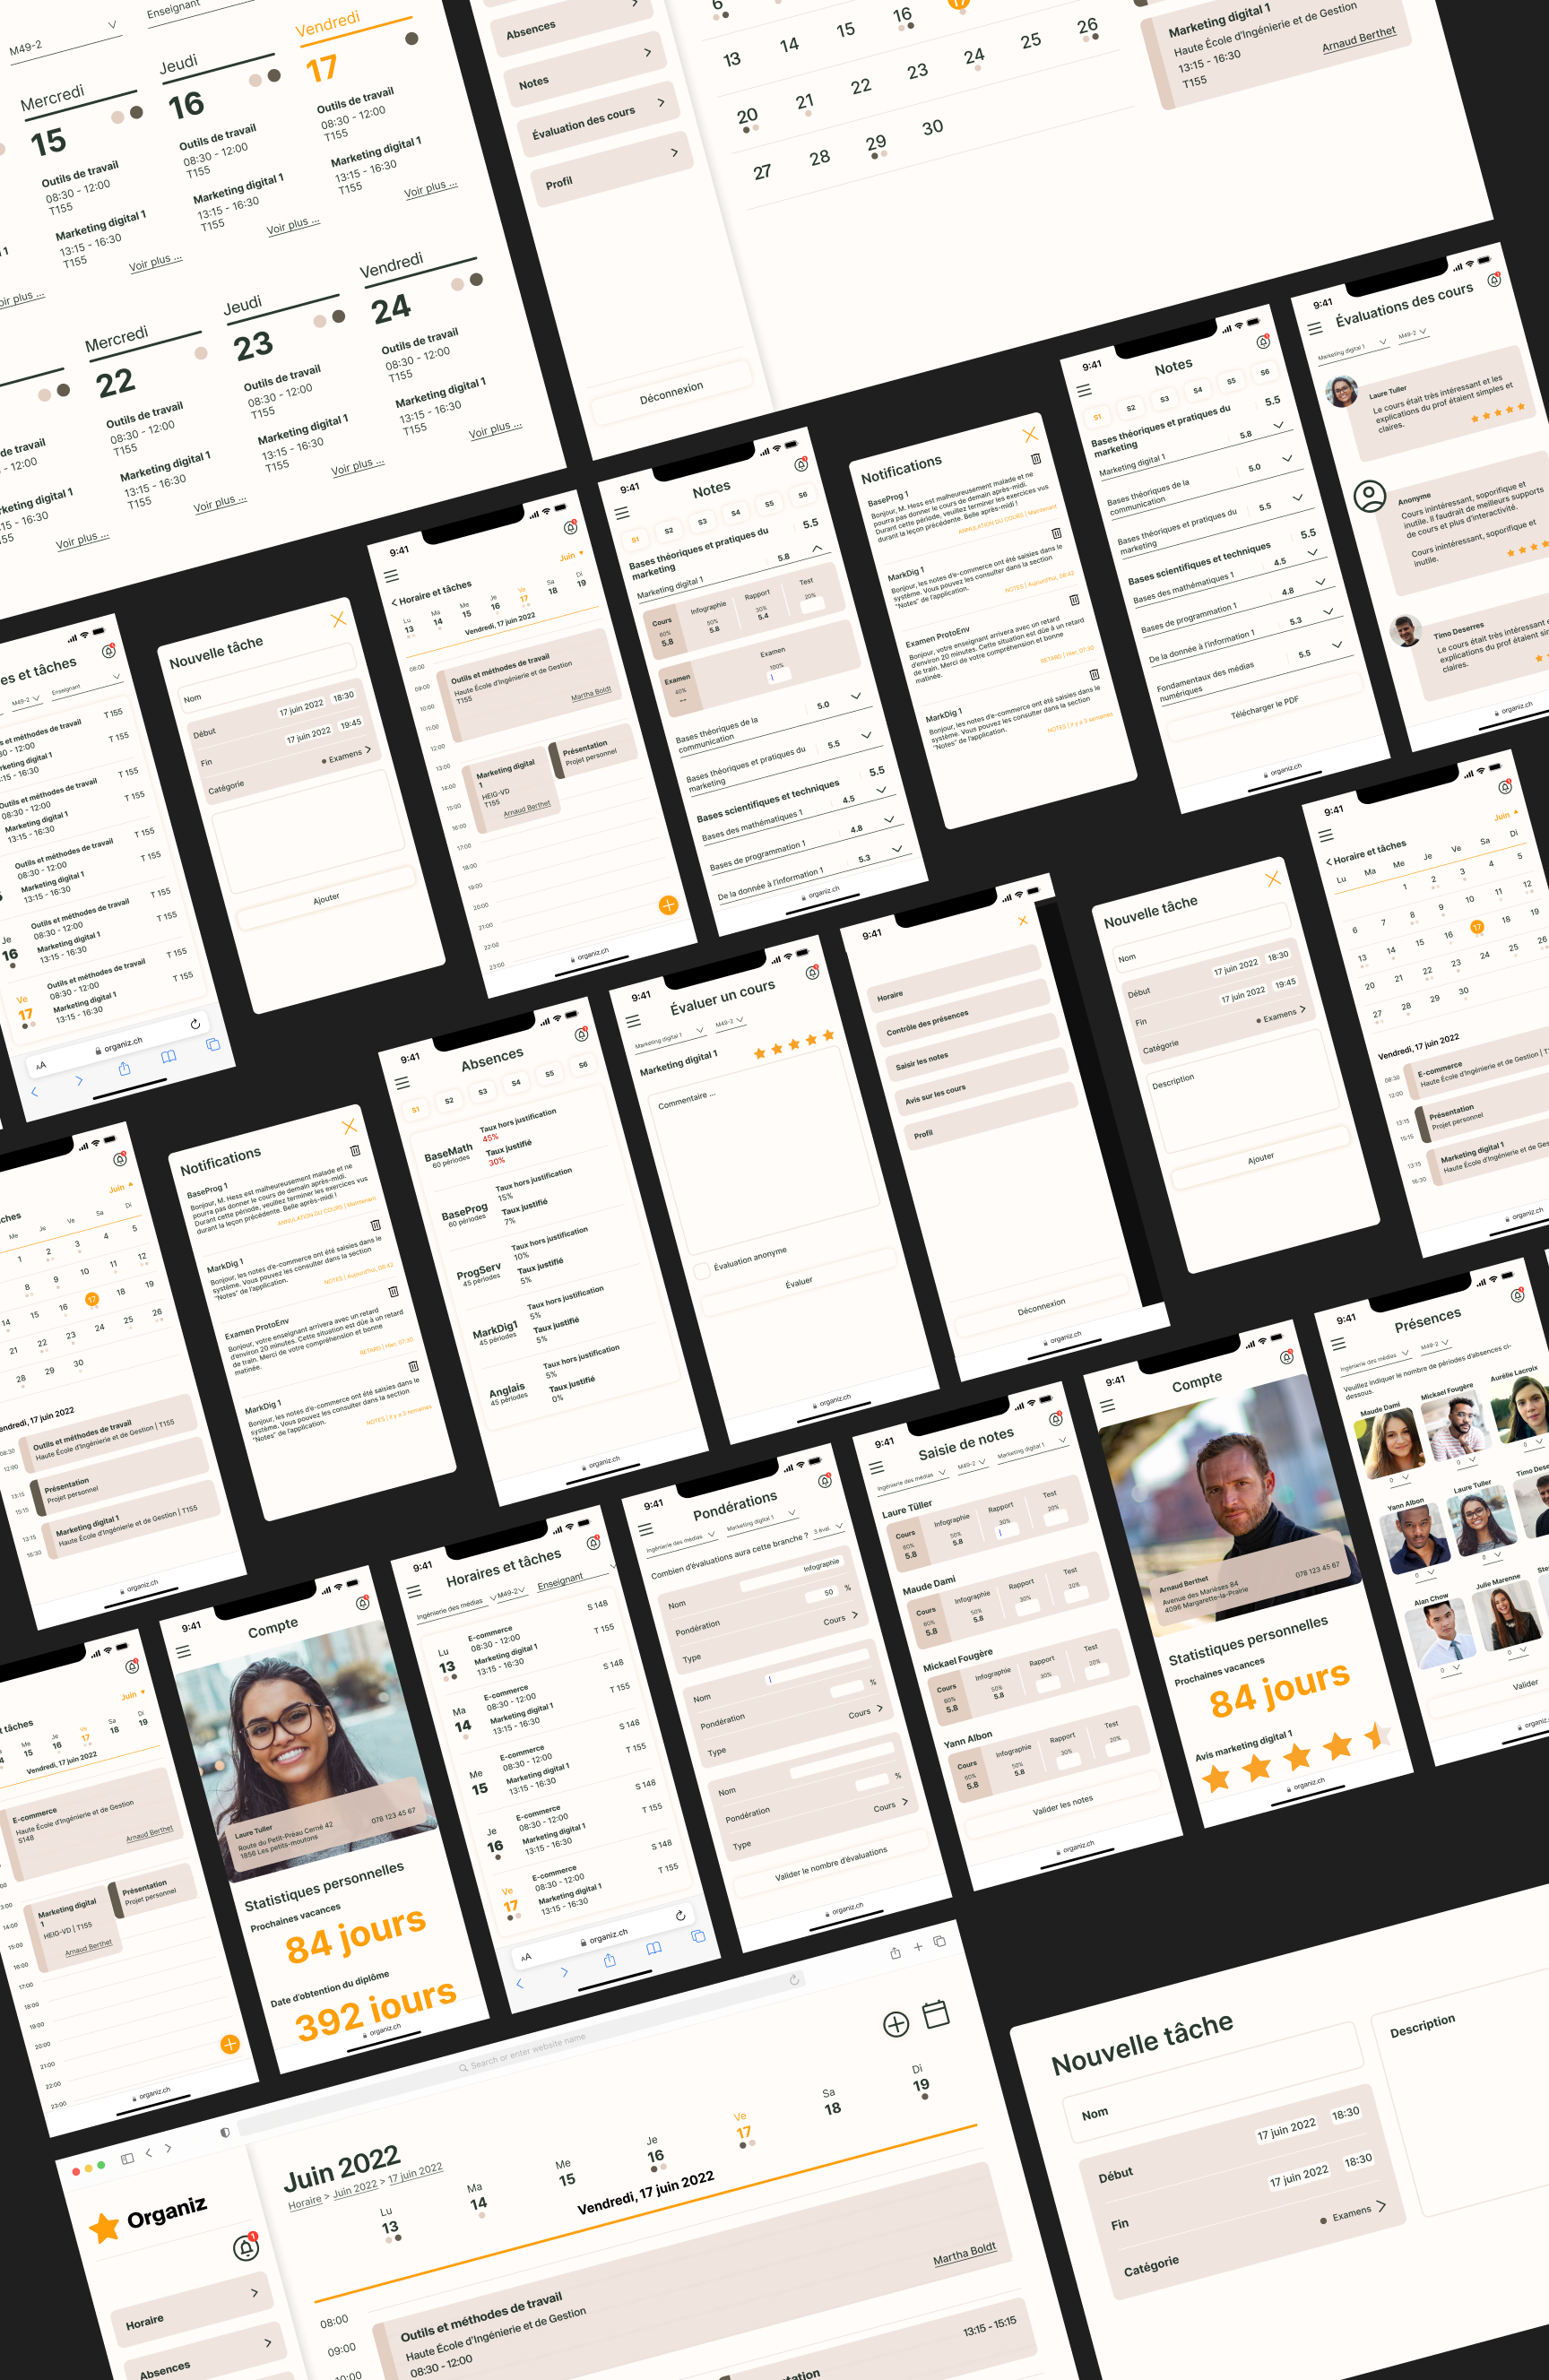
For the high-fidelity designs, we once again started with the mobile-first approach to ensure the design was optimized for mobile devices. However, due to time constraints and the project falling behind schedule, we skipped creating low-fidelity mockups for the desktop version and proceeded directly with high-fidelity designs. This decision allowed us to focus on the visual details and finalize the overall design without compromising the user experience on mobile. We ensured consistency across devices while adapting the layout and features to fit the larger screens of desktop users.
Several enhancements could be made to further refine the system. Given the variety of stakeholder needs, additional iterations could focus on improving customization options, allowing users to personalize their scheduling views or notifications. Implementing a more seamless integration between Vue.js and Laravel could enhance system performance and scalability. Moreover, considering the complexity of frontend development, leveraging plugins for specific components—rather than coding everything from scratch—could optimize development time.
One of the biggest challenges was time constraints, which required extra working hours to meet deadlines. The integration between Vue.js and Laravel proved to be more difficult than anticipated, leading to additional support requests from instructors. Additionally, a lack of coordination between the UX/UI team and the technical team initially caused misalignment in development priorities. To address this, we introduced daily morning meetings to ensure better synchronization.
Frontend development also presented difficulties, requiring additional guidance from instructors via Teams meetings. Differing visions within the UX/UI team led to challenges in decision-making, which were resolved through internal discussions. Midway through the project, changes were made to the documentation structure, requiring clarifications from instructors to ensure consistency. Finally, balancing the diverse needs of various stakeholders proved complex, but conducting surveys and interviews helped refine the system's priorities.
This project provided invaluable hands-on experience in collaborating across multiple disciplines, managing time effectively, and refining the UX/UI design process within real-world constraints. While the team faced technical and organizational challenges, solutions were found through teamwork, proactive communication, and flexibility. Looking back, stronger initial coordination between the UX/UI and technical teams, along with better anticipation of development difficulties, could have improved efficiency. However, the project was completed successfully, delivering a functional and user-centered scheduling system. The key takeaway is the importance of adaptability, structured planning, and continuous communication in ensuring a project's success.
Hestia.ai is a company founded in 2015 and acquired in 2020 by Paul-Olivier Dehaye, a mathematician involved in the Cambridge Analytica investigation. The company, composed of four employees, began its operations in 2021 and is currently based in Lausanne. Specialized in data, it trains and advises businesses on the ethical use of personal data.
In this project, the business strategy is built on a deep understanding of financial professionals’ needs while anticipating the impact of upcoming European data protection regulations. As an innovative initiative, the goal is not only to align with market expectations but also to create demand by showcasing the potential of a forward-thinking solution. While revenue streams and cost structure were not a primary focus at the company’s request, the work centered on identifying personas, mapping customer segments, and refining the value proposition to maximize the service’s impact.
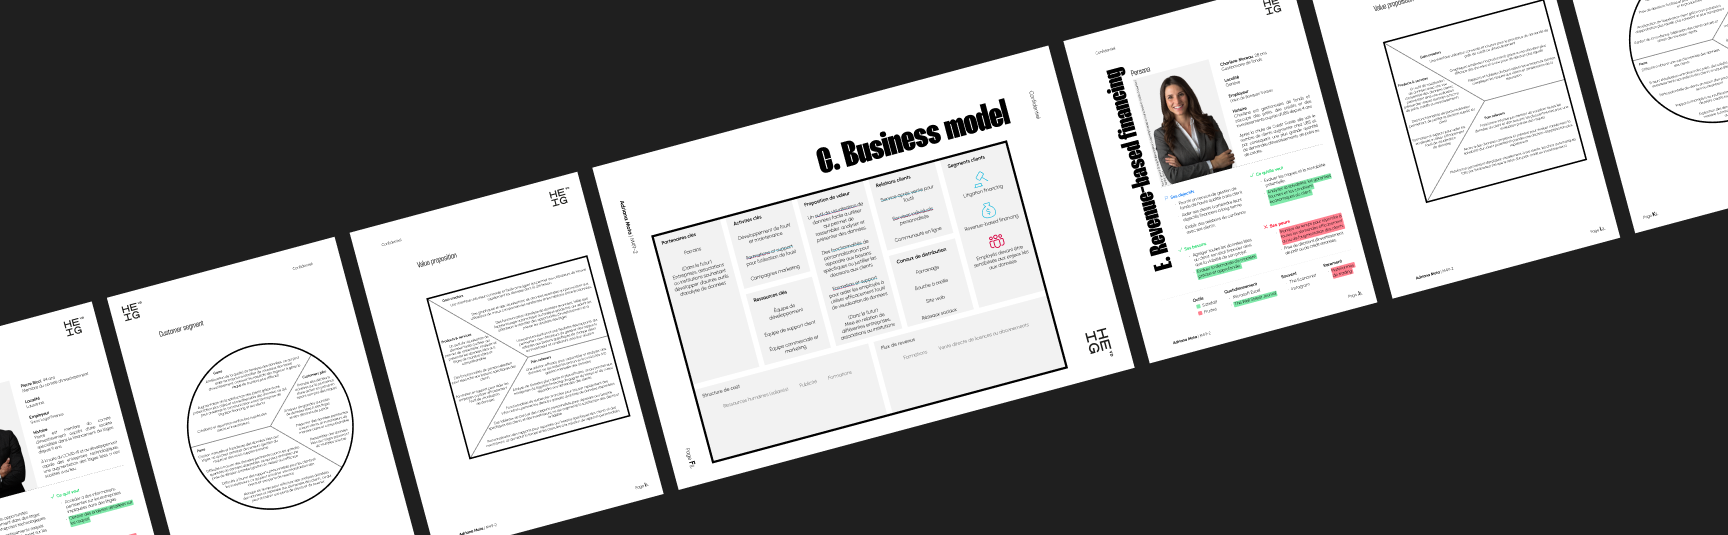
This Bachelor's project focuses primarily on the "Revenue-Based Financing" customer segment, aiming to design a solution that equips bankers with the tools to assess the viability of credit, loans, or investments for B2B clients - empowering them with new insights even before regulatory changes take effect.
I conducted qualitative interviews with bankers and lawyers to gain deeper insights into their current workflows, challenges, and expectations regarding financial data analysis and regulatory compliance. These discussions provided valuable firsthand perspectives, helping to shape the design of a solution that aligns with their processes and decision-making. Additionally, the insights gathered will inform the development of the service design, ensuring a seamless and user-centered experience.
The qualitative study conducted with bankers and lawyers revealed key challenges in their document management and decision-making processes. While both rely on digital documents, paper-based submissions remain an obstacle due to the need for manual digitization. A major difference lies in document analysis: lawyers must thoroughly review each file, making their process significantly longer than that of bankers, who benefit from analytical tools. Additionally, communication preferences vary, with bankers favoring phone calls and lawyers relying on emails. Lawyers also face difficulties in estimating work time within budget constraints, whereas bankers struggle with missing client documents. Concerns about security, reliability, and pricing were raised by lawyers regarding Hestia.ai’s tool, while bankers emphasized the need for a user-friendly interface providing only relevant insights.
Based on the needs expressed by the interviewees, particularly their request for a clean, user-friendly interface, a review of the current trends in data visualization and a dashboard benchmark followed. This helped to address their specific requirements and ensure that the design solutions proposed would meet their expectations for a functional and visually appealing tool.
Service design adopts a holistic approach by considering the entire user journey, identifying key moments, challenges, and opportunities for improvement in the interaction between the user and the service provider. This approach allows for the creation of services that deliver positive and consistent experiences.
The service design process can take various forms, but the service blueprint is particularly valuable. It enables a detailed visualization and description of the stages and interactions within the user journey. By providing a comprehensive view, the blueprint highlights the key actors involved, the touchpoints, the actions taken, and the resources used. Therefore, creating a service blueprint is crucial for the effective design of this future service.
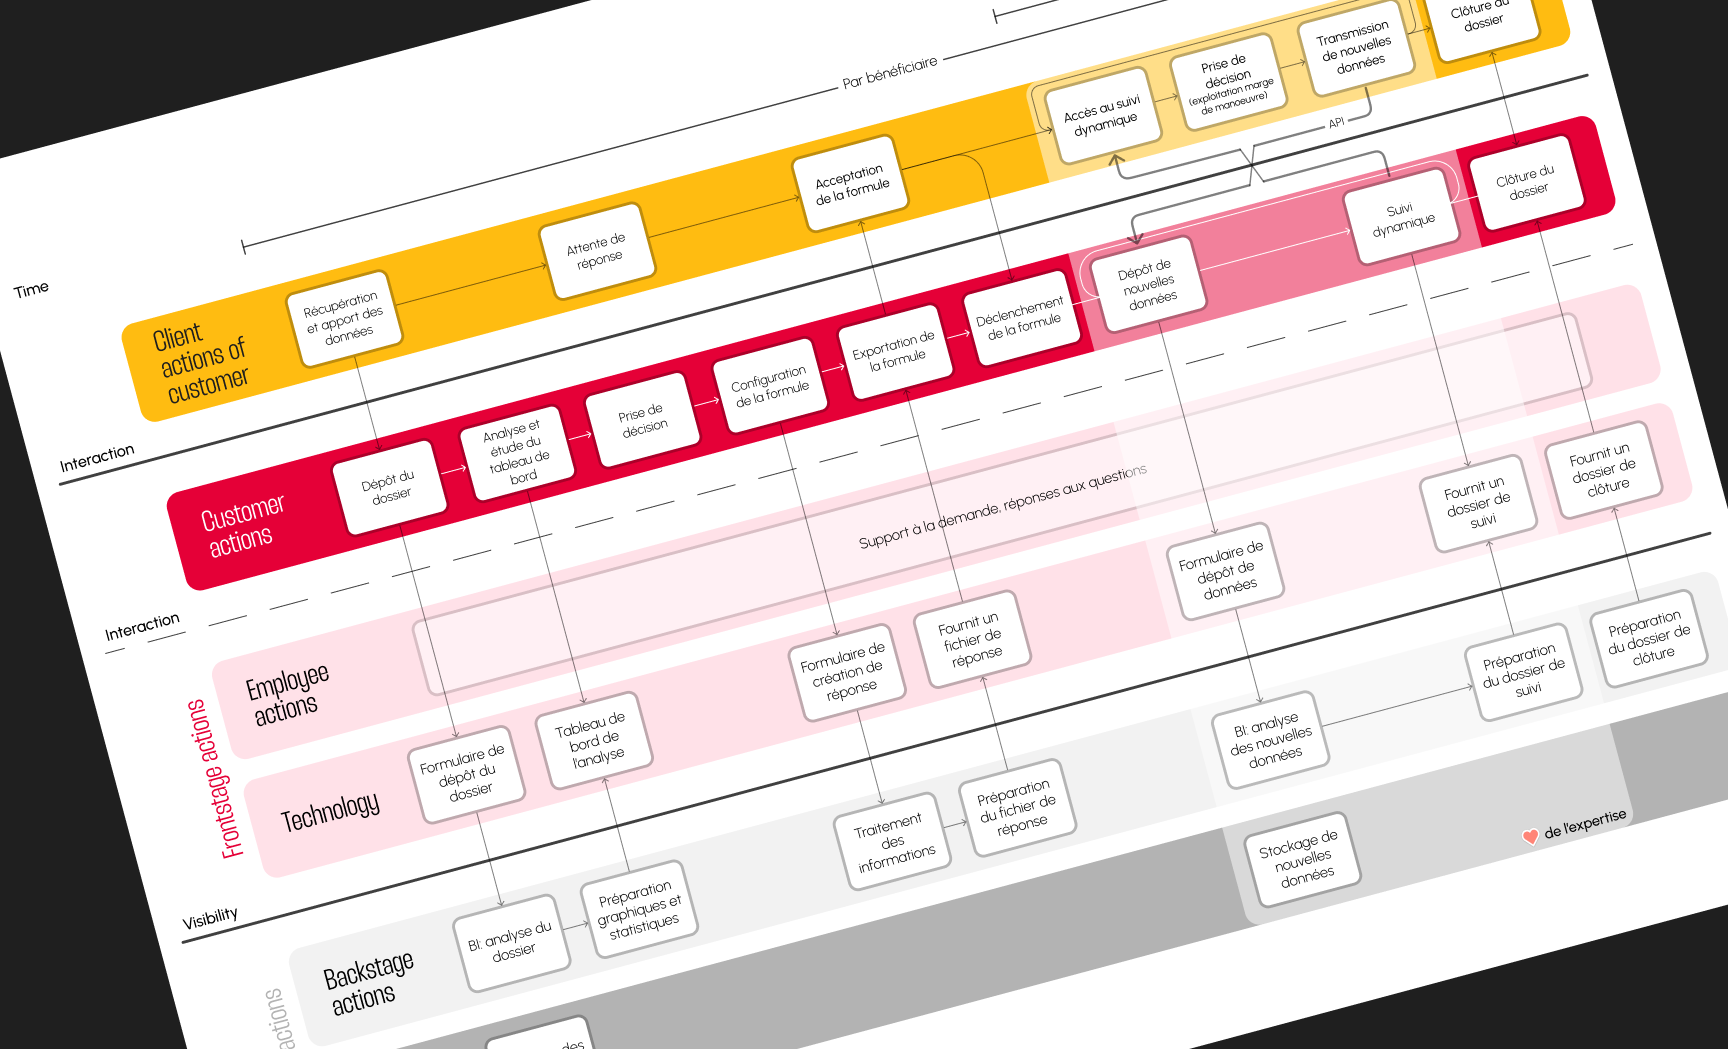
In addition to the previously mentioned benefits, the service blueprint also plays a significant role in internal communication. Finally, as this is a B2B service, the final client is also considered in the diagram on the next page.
The moodboard was designed to convey a sense of simplicity and ease. It uses a neutral color palette as a base to create a clean and minimalist look, with strategic pops of stronger colors to add impact in specific areas. The elements are carefully sized, with soft curves and shapes, enhancing the overall inviting and accessible feel. The goal is to evoke a sense of professionalism and value while maintaining a light, easy-to-understand, and visually uncluttered atmosphere.
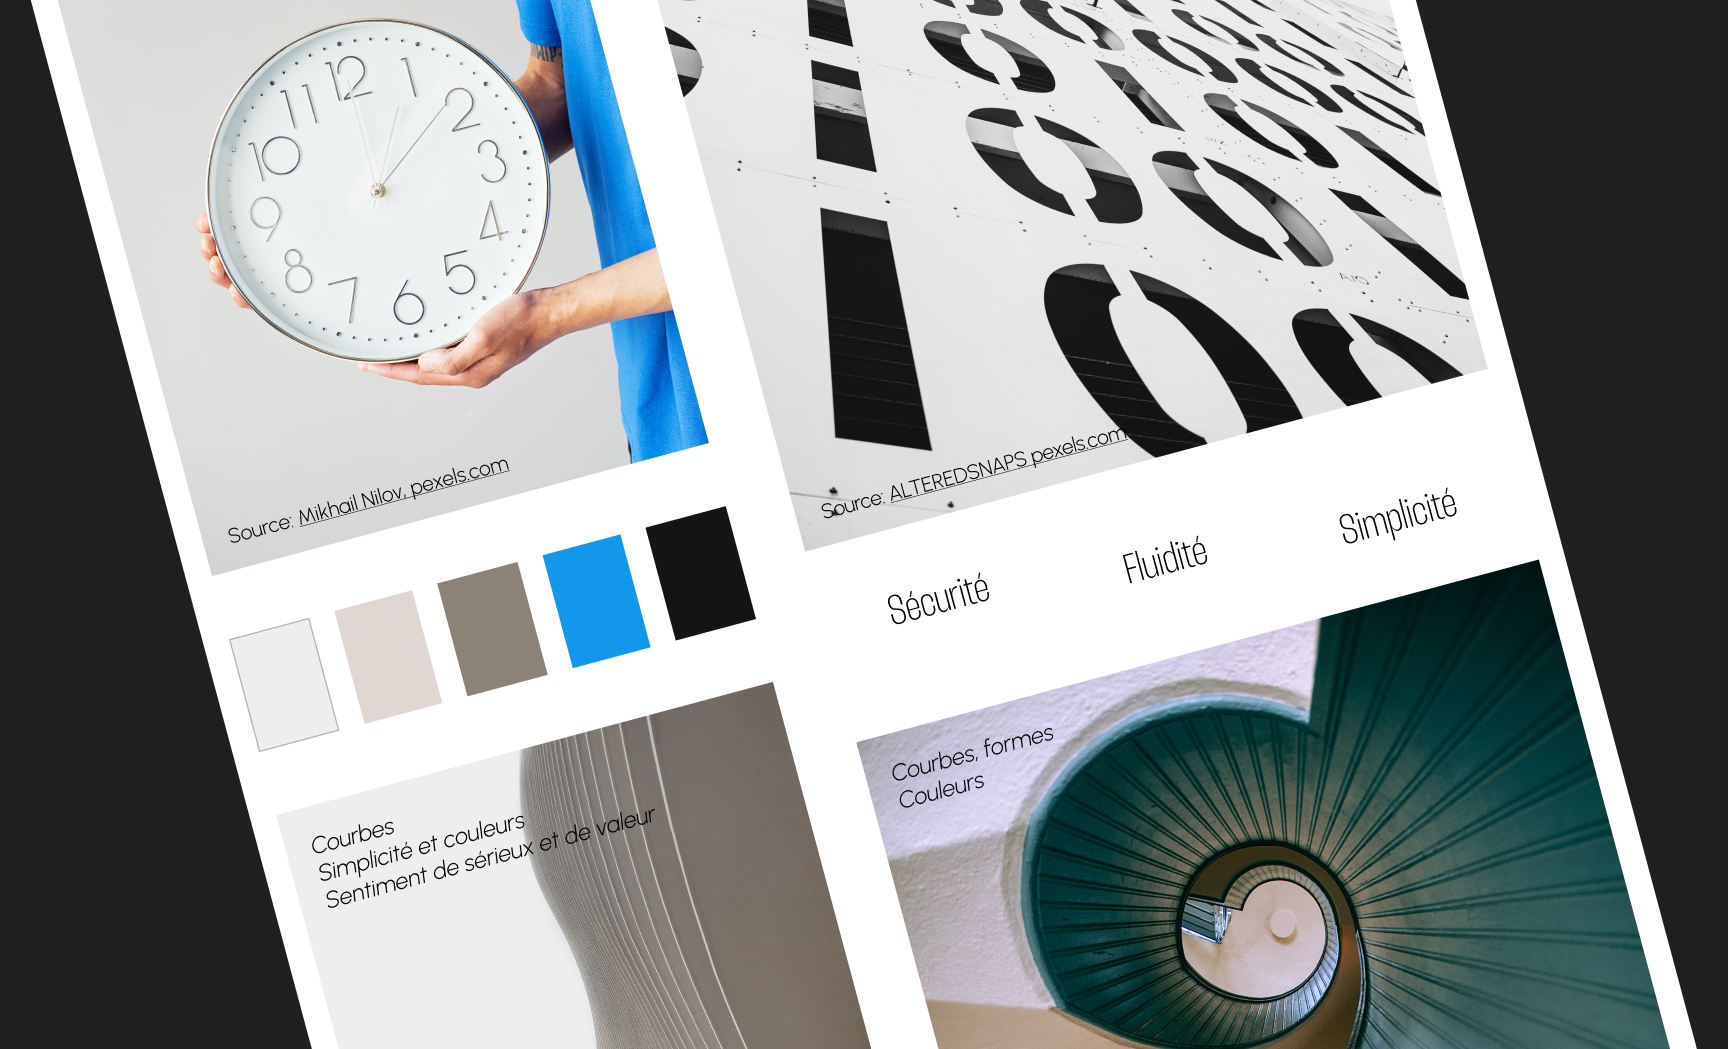
The graphic charter defines the visual identity of the service, creating a strong visual coherence across all interfaces, whether on desktop or mobile. It is structured around several key elements:
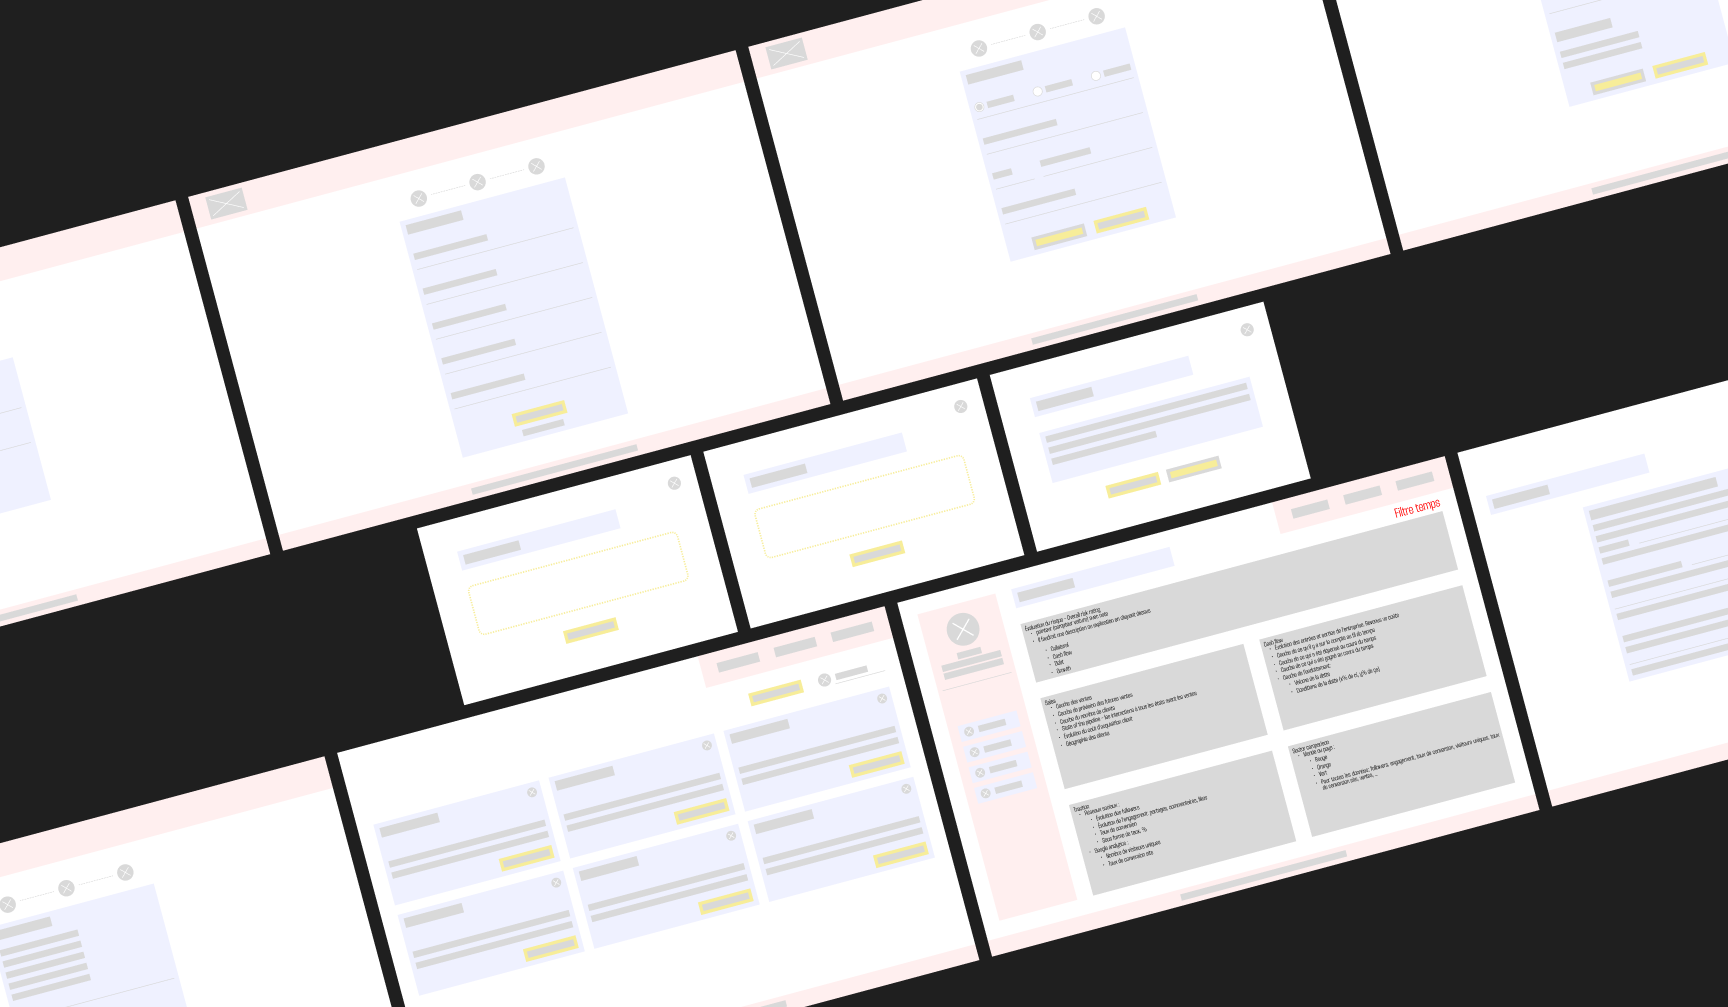
For this project, low-fidelity wireframes were primarily used as a communication tool with other members of the company. The goal was to gather their feedback on the structure and functionality of the service, without focusing on visual details or final design. This allowed for quick testing and adjustment of ideas before moving on to more detailed design stages.
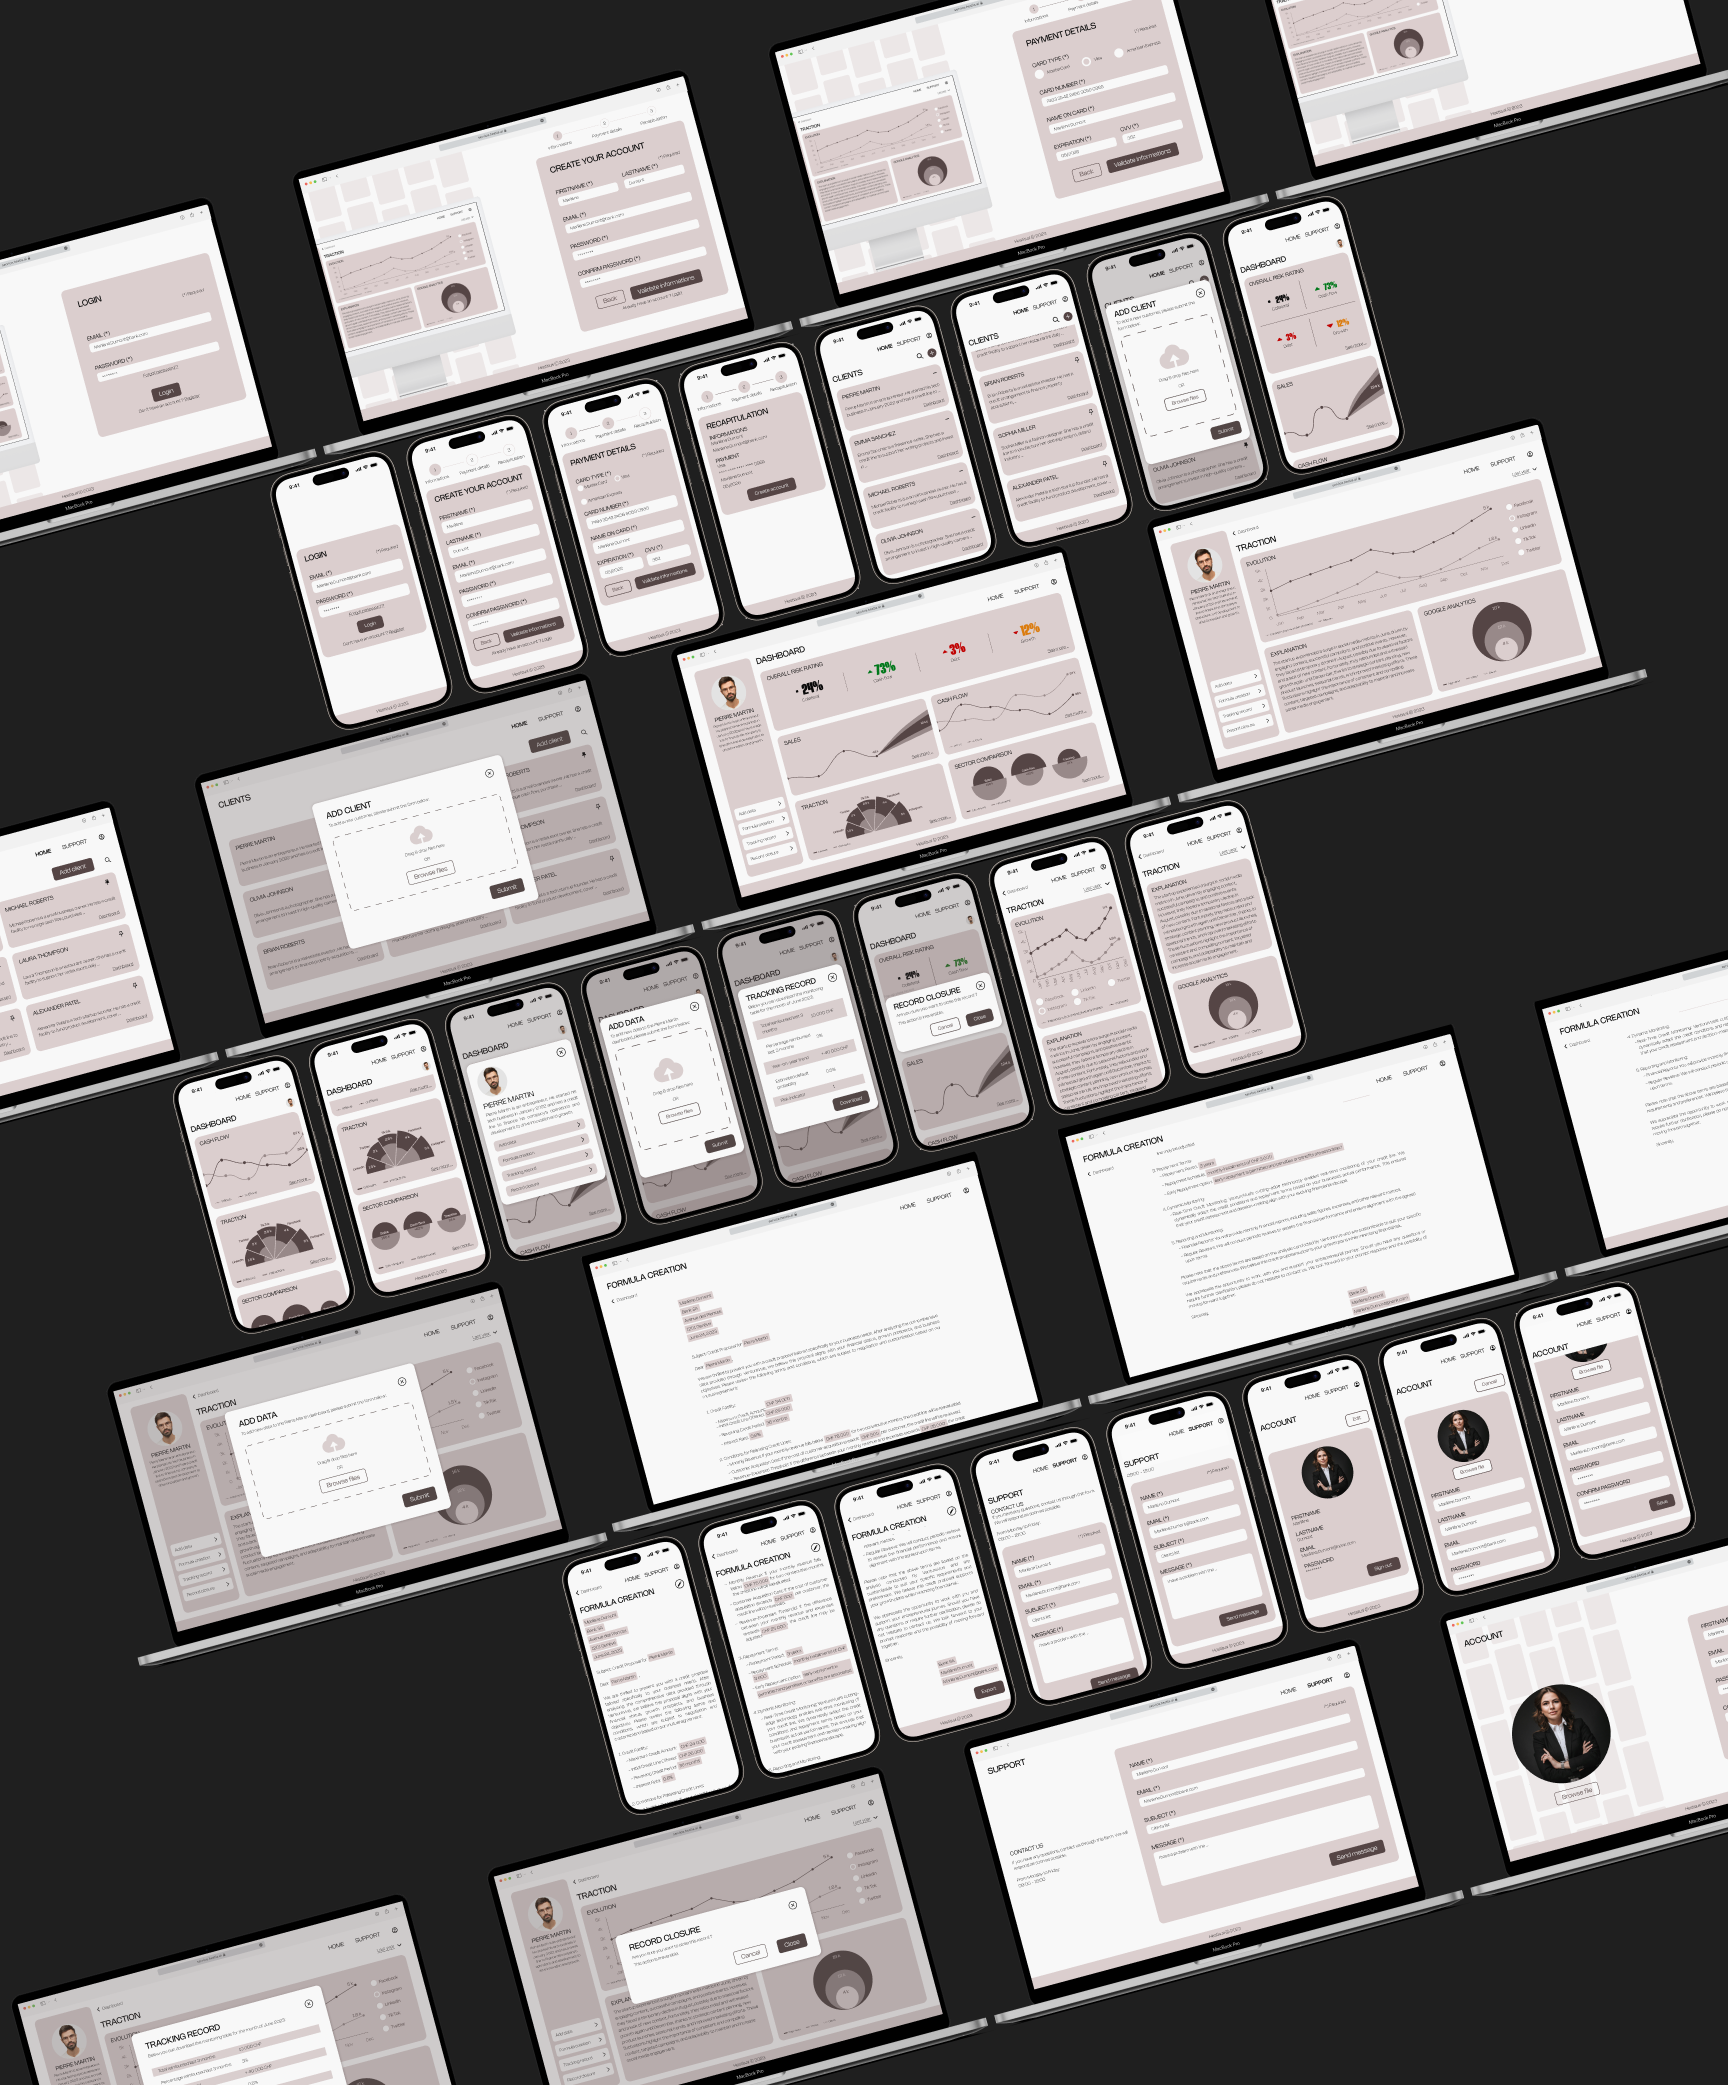
In developing the high-fidelity designs for this service, one of the key challenges was determining which information to display on the dashboard. This project uncertainty required a forward-thinking approach, where we had to imagine what data would be available in the future, even though it wasn’t yet defined. The data that would eventually populate the service wasn’t just important for choosing the right types of charts for the dashboard but also critical for identifying the most relevant and valuable information for the end users.
Designing an interface capable of managing such diverse and undefined data sources while ensuring a clean, intuitive, and user-friendly experience presented significant challenges. The goal was not only to provide a functional solution but to also address user needs in a way that felt cohesive and effective.
User testing was a crucial phase to evaluate the usability and clarity of the dashboard interface. One of the main challenges was identifying the key information to display, given that the service anticipates future European regulations. Additionally, recruiting suitable participants proved difficult, as the initially interviewed users were unavailable. To address this, new volunteers were selected based on predefined criteria to match the target audience. The tests were conducted using an interactive Figma prototype and a think-aloud approach, allowing real-time insights into user interactions. Recorded sessions facilitated in-depth analysis, helping to refine the interface by addressing usability issues and ensuring an intuitive user experience.
To further enhance the user experience, several improvements have been proposed. Personalizing the dashboard would allow users to tailor their interface by selecting key charts, setting default time filters, and organizing elements to fit their needs. Contextual help, such as tooltips, could also improve clarity by providing quick explanations of technical terms. Ensuring accessibility compliance with WCAG guidelines is essential for inclusivity. Additionally, expanding user testing beyond the dashboard to other service areas would provide valuable insights for continuous improvement. Future iterations of the service could introduce a client-facing interface, allowing entrepreneurs to input data directly, and a customizable version for banks, reinforcing brand identity and trust.
Throughout this Bachelor’s project, various challenges were identified. First, finding volunteer bankers for user testing proved more difficult than expected. Constraints such as holiday periods or bankers' unavailability at the time of testing made it challenging to reach potential future users. Despite this, individuals with similar characteristics to bankers were found to provide relevant feedback and gather useful insights for improving the service.
Time constraints were a recurring challenge throughout the Bachelor’s project. Due to various limitations, it was not possible to conduct user tests with the ideal target audience, requiring additional research and causing delays in the timeline. Moreover, the introduction of Figma’s new update required time to adapt to new features. Ideally, dedicating more time to user testing would have allowed for more comprehensive feedback across all service pages. This would have provided a deeper evaluation of the user experience and more precisely identified areas for improvement to better meet user needs.
Finally, on a personal level, unexpected events made managing the Bachelor’s project alongside private life more complex. A portion of the work had to be completed remotely, requiring adaptation in organization and communication with the company. Frequent exchanges with the Hestia.ai team via Discord were essential for maintaining strong collaboration despite the distance. This required careful planning of meetings, clear communication to ensure smooth information flow, and coordination for signing necessary documents. However, dealing with these challenges and constraints became a valuable learning opportunity in terms of flexibility, communication, and resilience within a demanding professional environment.
These obstacles, while challenging, ultimately contributed to the learning process. They highlighted the importance of adaptability in a real-world project, reinforcing the need for proactive problem-solving and efficient time management. Despite the constraints, the experience provided valuable insights into handling unexpected situations, optimizing collaboration in a professional setting, and ensuring the continuity of a project under evolving conditions.
This data visualization service project for Hestia.ai is highly relevant in light of evolving data protection regulations. By developing a solution that complies with future European laws, Hestia.ai is positioning itself as a market leader, fostering data protection awareness and user trust. The service was built with a methodical approach, resulting in prototypes that effectively showcase the interface and key features.
User testing yielded positive feedback, with an average score of 88 on the SUS scale, confirming the service's user-friendliness and effectiveness. This result validates the project's design approach, ensuring the interface is intuitive and easily navigable. The feedback gathered will guide further improvements to meet users' evolving needs.
On a personal level, this Bachelor’s project was a valuable learning experience. It allowed me to develop skills in service design, UX, and project management while working closely with the Hestia.ai team. The challenges faced, from time constraints to unexpected changes, helped me grow in flexibility and resilience. I’m grateful for the opportunity to contribute to an innovative project and look forward to seeing its impact in the future.